
Shareholder Letter Q1 2025
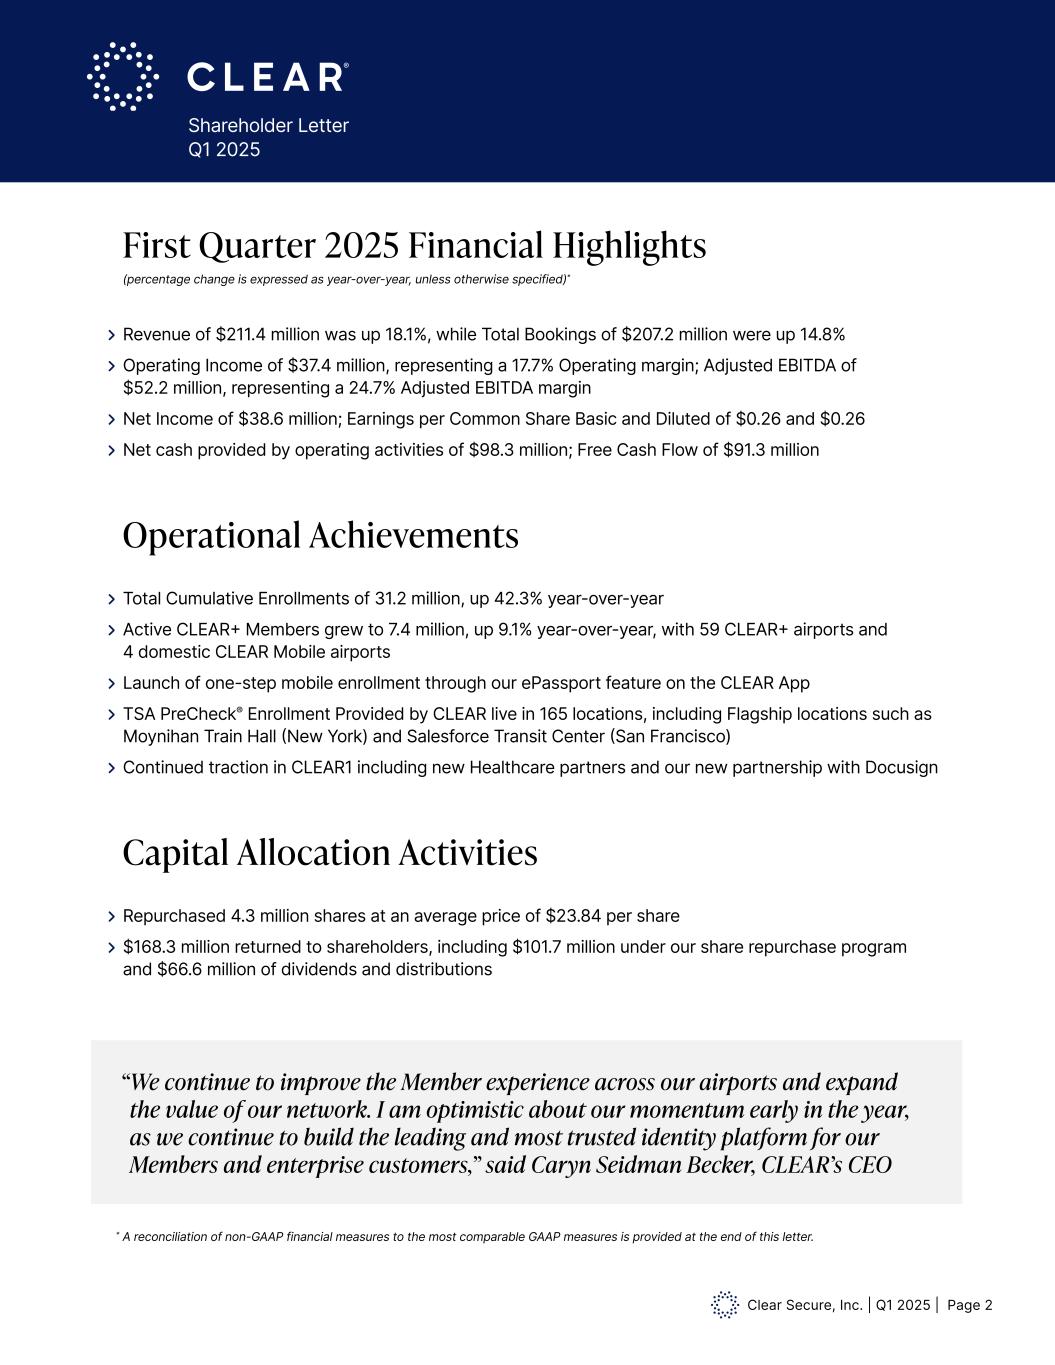
Clear Secure, Inc. | Q1 2025 | Page 2 Shareholder Letter Q1 2025 First Quarter 2025 Financial Highlights (percentage change is expressed as year-over-year, unless otherwise specified)* Revenue of $211.4 million was up 18.1%, while Total Bookings of $207.2 million were up 14.8% Operating Income of $37.4 million, representing a 17.7% Operating margin; Adjusted EBITDA of $52.2 million, representing a 24.7% Adjusted EBITDA margin Net Income of $38.6 million; Earnings per Common Share Basic and Diluted of $0.26 and $0.26 Net cash provided by operating activities of $98.3 million; Free Cash Flow of $91.3 million Operational Achievements Total Cumulative Enrollments of 31.2 million, up 42.3% year-over-year Active CLEAR+ Members grew to 7.4 million, up 9.1% year-over-year, with 59 CLEAR+ airports and 4 domestic CLEAR Mobile airports Launch of one-step mobile enrollment through our ePassport feature on the CLEAR App TSA PreCheck® Enrollment Provided by CLEAR live in 165 locations, including Flagship locations such as Moynihan Train Hall (New York) and Salesforce Transit Center (San Francisco) Continued traction in CLEAR1 including new Healthcare partners and our new partnership with Docusign Capital Allocation Activities Repurchased 4.3 million shares at an average price of $23.84 per share $168.3 million returned to shareholders, including $101.7 million under our share repurchase program and $66.6 million of dividends and distributions * A reconciliation of non-GAAP financial measures to the most comparable GAAP measures is provided at the end of this letter. “ We continue to improve the Member experience across our airports and expand the value of our network. I am optimistic about our momentum early in the year, as we continue to build the leading and most trusted identity platform for our Members and enterprise customers,” said Caryn Seidman Becker, CLEAR’s CEO
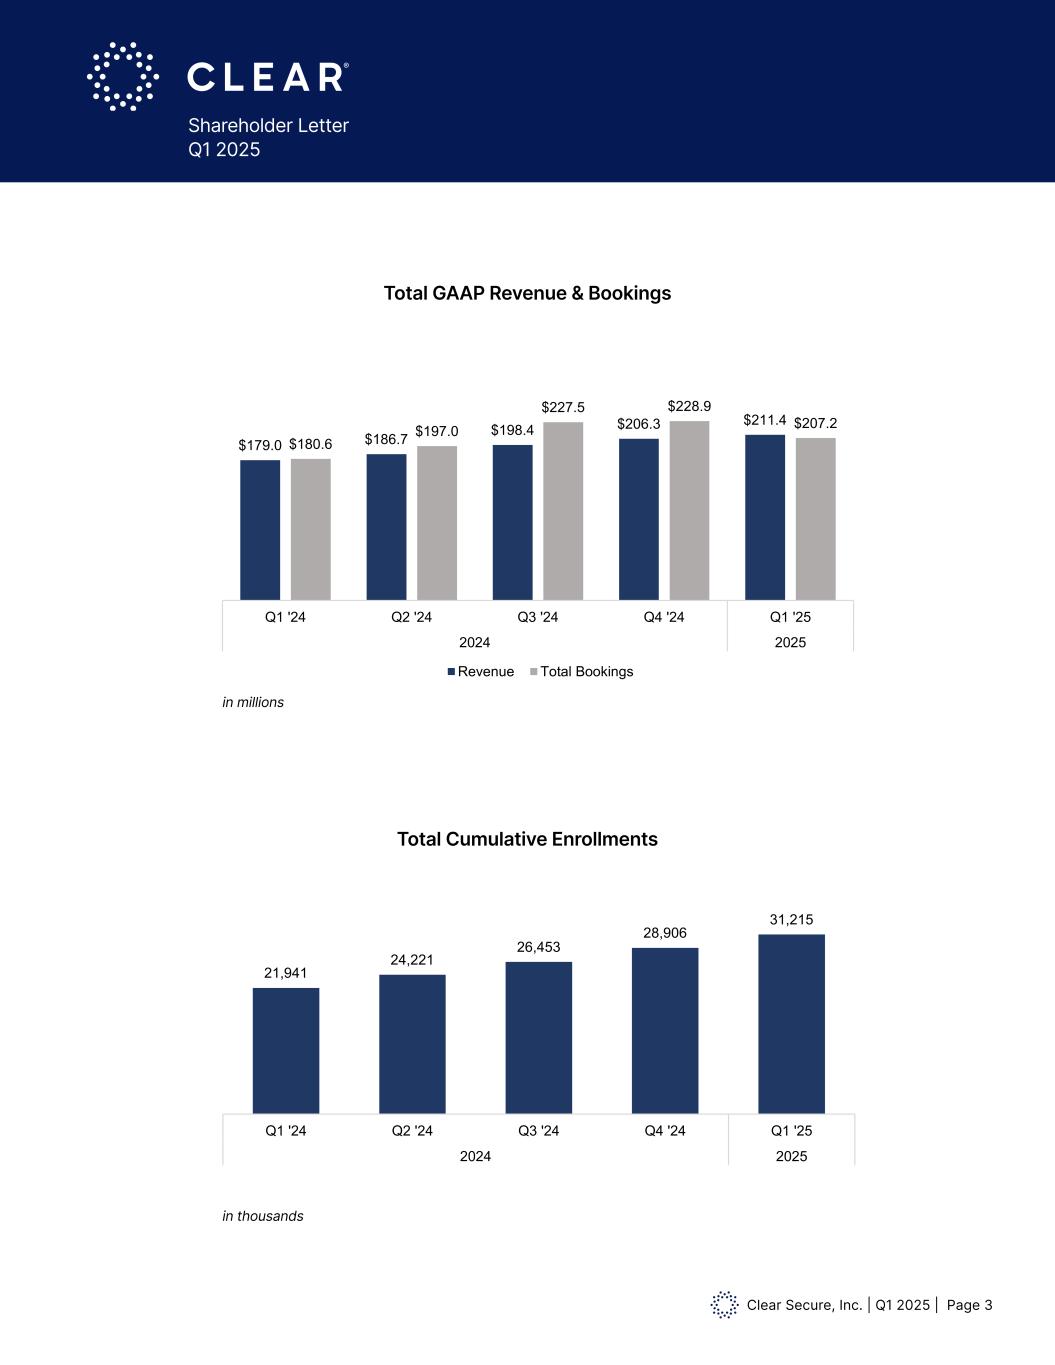
Clear Secure, Inc. | Q1 2025 | Page 3 Shareholder Letter Q1 2025 $179.0 $186.7 $198.4 $206.3 $211.4 $180.6 $197.0 $227.5 $228.9 $207.2 Q1 '24 Q2 '24 Q3 '24 Q4 '24 Q1 '25 2024 2025 Total GAAP Revenue & Bookings Revenue Total Bookings 192,610 206,673 220,413 234,821 248,895 Q1 '24 Q2 '24 Q3 '24 Q4 '24 Q1 '25 2024 2025 Total Cumulative Platform Uses (Thousands) 89.8% 89.3% 89.0% 88.5% 87.1% Q1 '24 Q2 '24 Q3 '24 Q4 '24 Q1 '25 2024 2025 Annual CLEAR + Gross Dollar Retention 7.8x 7.4x 7.1x 7.1x 7.1x Q1 '24 Q2 '24 Q3 '24 Q4 '24 Q1 '25 2024 2025 Annualized CLEAR + Member Usage 6,798 7,095 7,150 7,315 7,415 Q1 '24 Q2 '24 Q3 '24 Q4 '24 Q1 '25 2024 2025 Acitve CLEAR + Members (Thousands) 21,941 24,221 26,453 28,906 31,215 Q1 '24 Q2 '24 Q3 '24 Q4 '24 Q1 '25 2024 2025 Total Cumulative Enrollments (Thousands) in millions in thousands Total GAAP Revenue & Bookings Total Cumulative Enrollments
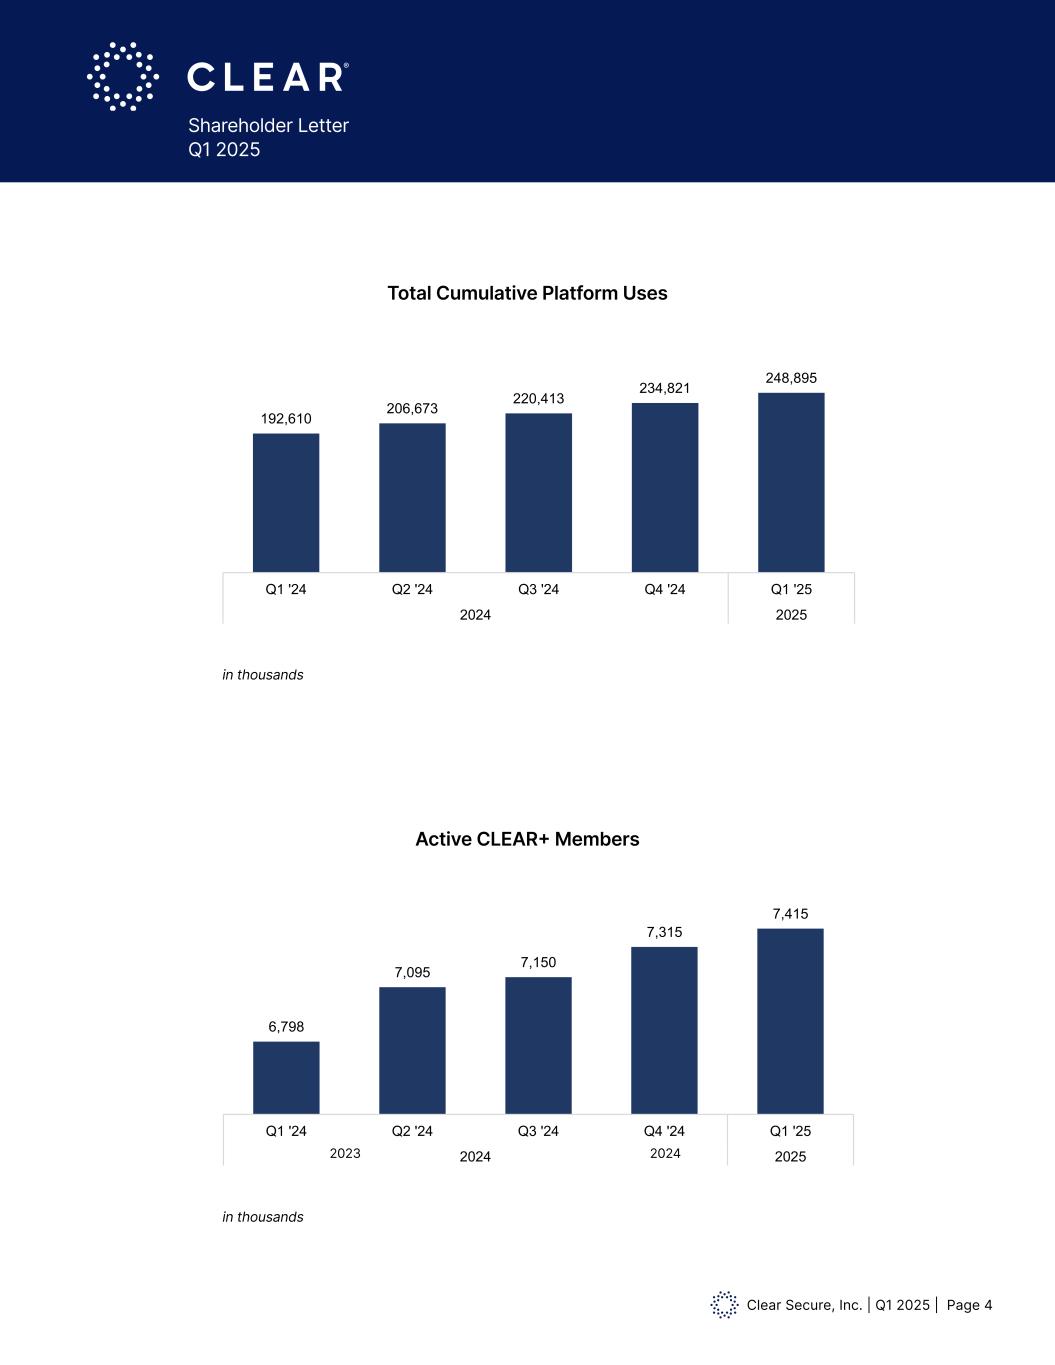
Clear Secure, Inc. | Q1 2025 | Page 4 Shareholder Letter Q1 2025 Total Cumulative Platform Uses $179.0 $186.7 $198.4 $206.3 $211.4 $180.6 $197.0 $227.5 $228.9 $207.2 Q1 '24 Q2 '24 Q3 '24 Q4 '24 Q1 '25 2024 2025 Total GAAP Revenue & Bookings Revenue Total Bookings 192,610 206,673 220,413 234,821 248,895 Q1 '24 Q2 '24 Q3 '24 Q4 '24 Q1 '25 2024 2025 Total Cumulative Platform Uses (Thousands) 89.8% 89.3% 89.0% 88.5% 87.1% Q1 '24 Q2 '24 Q3 '24 Q4 '24 Q1 '25 2024 2025 Annual CLEAR + Gross Dollar Retentionin thousands Active CLEAR+ Members $149.9 $160.4 $171.0 $179.0 $186.7 $175.1 $191.7 $195.3 $180.6 $197.0 Q2 '23 Q3 '23 Q4 '23 Q1 '24 Q2 '24 2023 2024 Total GAAP Revenue & Bookings Revenue Total Bookings 17,385 18,594 20,194 21,941 24,211 Q2 '23 Q3 '23 Q4 '23 Q1 '24 Q2 '24 2023 2024 Total Cumulative Enrollments (Thousands) 154,317 167,417 180,807 192,610 206,673 Q2 '23 Q3 '23 Q4 '23 Q1 '24 Q2 '24 2023 2024 Total Cumulative Platform Uses (Thousands) Annual CLEAR Plus Gross Dollar Retention 7.8x 7.4x 7.1x 7.1x 7.1x Q1 '24 Q2 '24 Q3 '24 Q4 '24 Q1 '25 2024 2025 Annualized CLEAR + Member Usage 6,798 7,095 7,150 7,315 7,415 1 4 2 '24 Q3 '24 Q4 '24 Q1 '25 2024 2025 Acitve CLEAR + Members (Thousands) 21,941 24,221 26,453 28,906 31,215 Q1 '24 Q2 '24 Q3 '24 Q4 '24 Q1 '25 2024 2025 Total Cumulative Enrollments (Thousands) in thousands 20242023
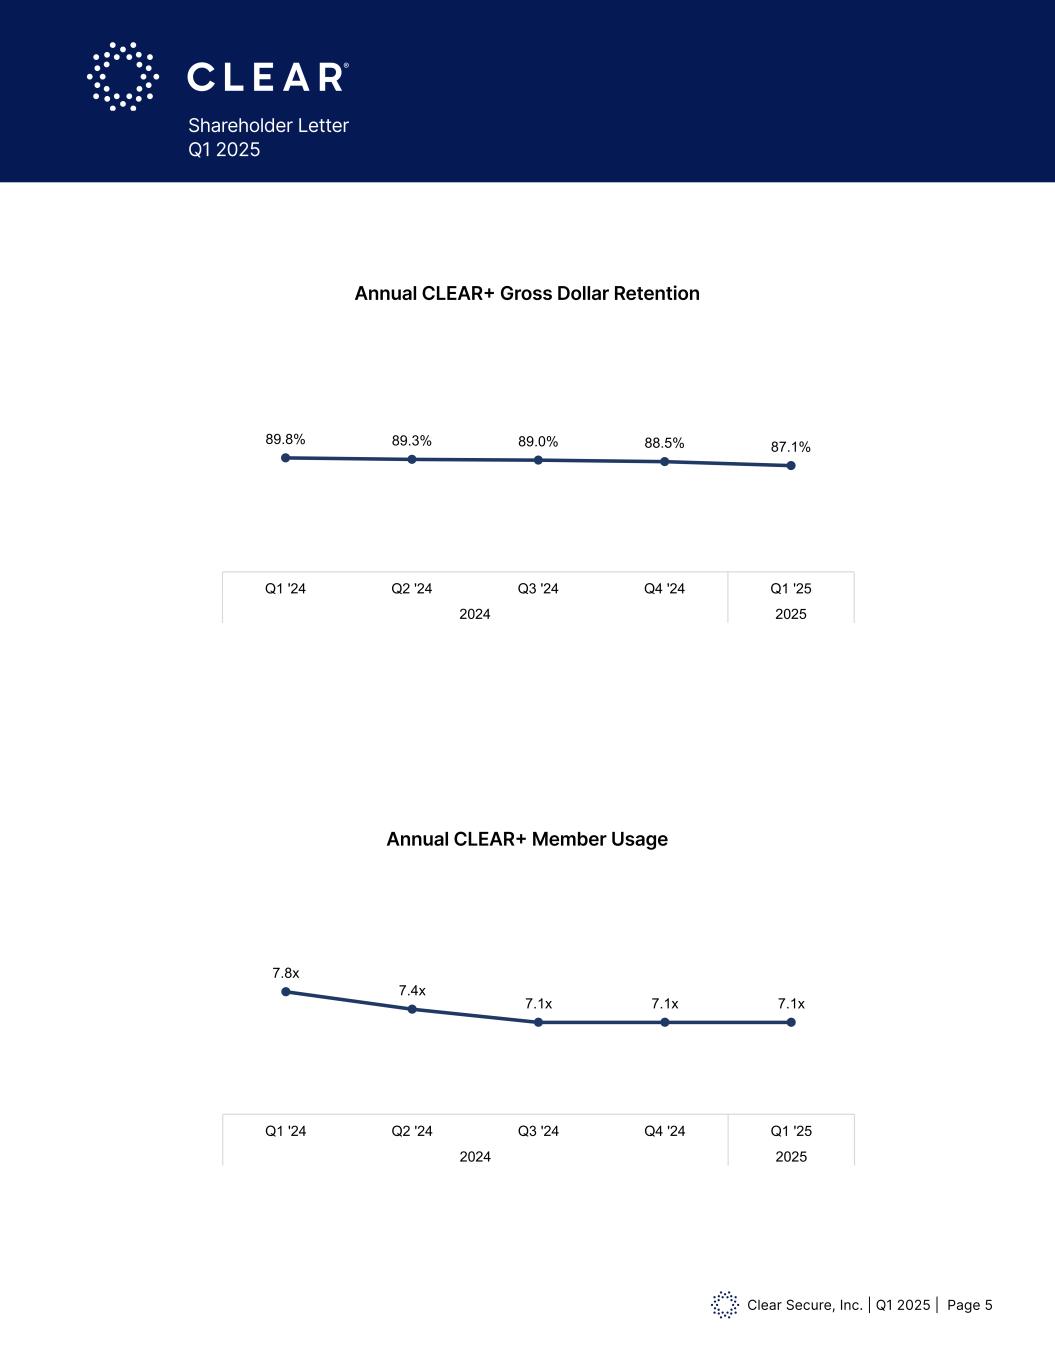
Clear Secure, Inc. | Q1 2025 | Page 5 Shareholder Letter Q1 2025 $179.0 $186.7 $198.4 $206.3 $211.4 $180.6 $197.0 $227.5 $228.9 $207.2 Q1 '24 Q2 '24 Q3 '24 Q4 '24 Q1 '25 2024 2025 Total GAAP Revenue & Bookings Revenue Total Bookings 192,610 206,673 220,413 234,821 248,895 Q1 '24 Q2 '24 Q3 '24 Q4 '24 Q1 '25 2024 2025 Total Cumulative Platform Uses (Thousands) 89.8% 89.3% 89.0% 88.5% 87.1% Q1 '24 Q2 '24 Q3 '24 Q4 '24 Q1 '25 2024 2025 Annual CLEAR + Gross Dollar Retention Annual CLEAR+ Gross Dollar Retention 7.8x 7.4x 7.1x 7.1x 7.1x Q1 '24 Q2 '24 Q3 '24 Q4 '24 Q1 '25 2024 2025 Annualized CLEAR + Member Usage 6,798 7,095 7,150 7,315 7,415 Q1 '24 Q2 '24 Q3 '24 Q4 '24 Q1 '25 2024 2025 Acitve CLEAR + Members (Thousands) 21,941 24,2 1 26,453 28,906 31,215 Q1 '24 Q2 '24 Q3 '24 Q4 '24 Q1 '25 2024 2025 Total Cumulative Enrollments (Thousands) Annual CLEAR+ Member Usage
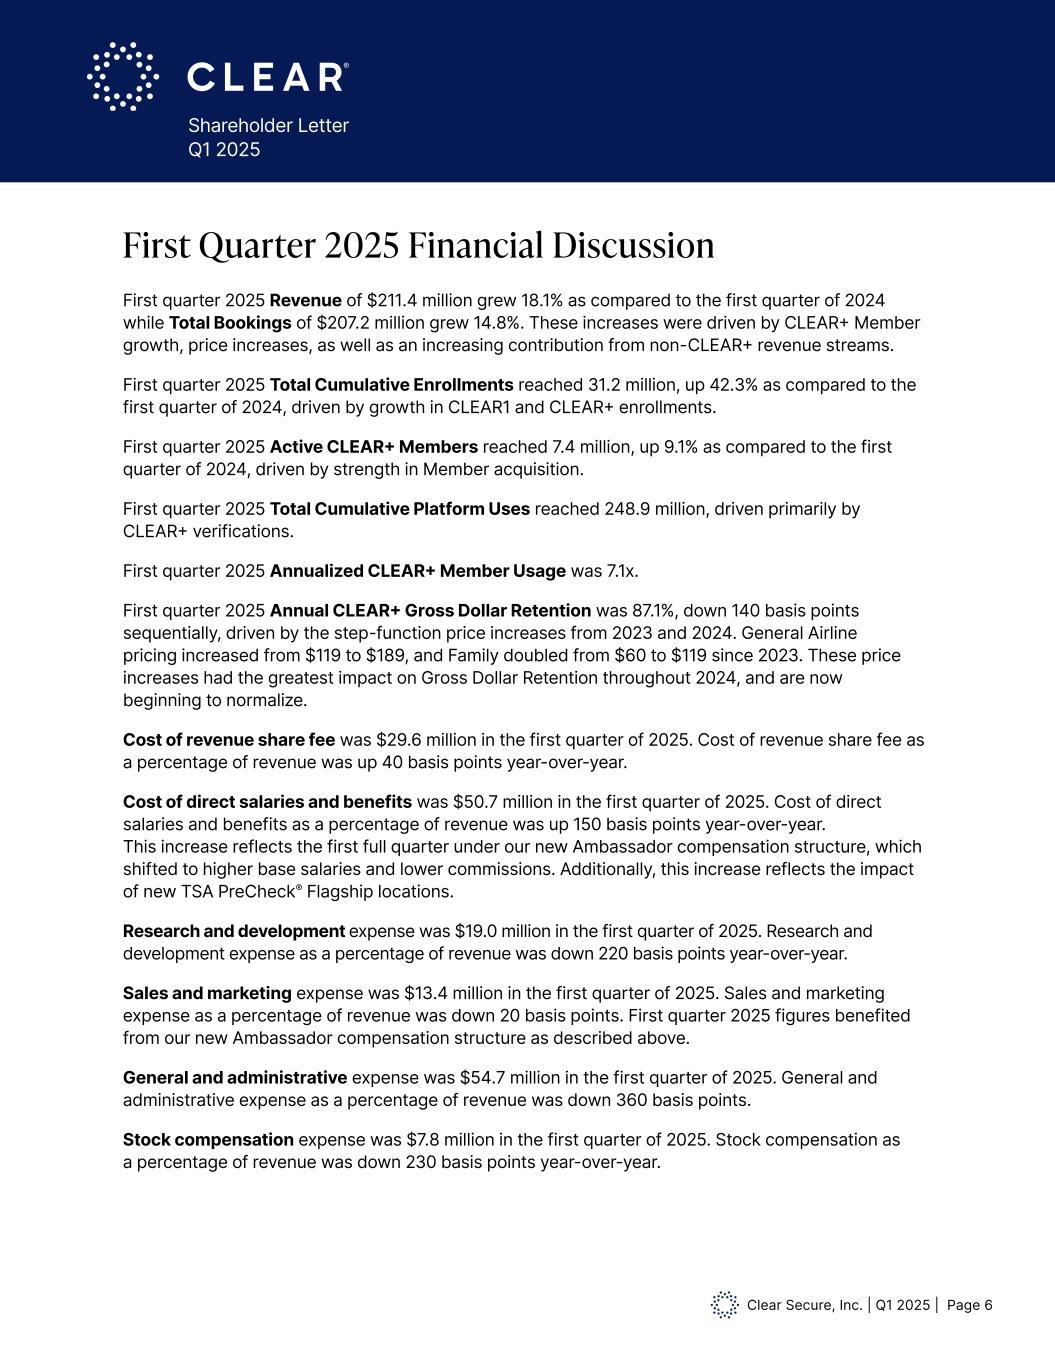
Clear Secure, Inc. | Q1 2025 | Page 6 Shareholder Letter Q1 2025 First quarter 2025 Revenue of $211.4 million grew 18.1% as compared to the first quarter of 2024 while Total Bookings of $207.2 million grew 14.8%. These increases were driven by CLEAR+ Member growth, price increases, as well as an increasing contribution from non-CLEAR+ revenue streams. First quarter 2025 Total Cumulative Enrollments reached 31.2 million, up 42.3% as compared to the first quarter of 2024, driven by growth in CLEAR1 and CLEAR+ enrollments. First quarter 2025 Active CLEAR+ Members reached 7.4 million, up 9.1% as compared to the first quarter of 2024, driven by strength in Member acquisition. First quarter 2025 Total Cumulative Platform Uses reached 248.9 million, driven primarily by CLEAR+ verifications. First quarter 2025 Annualized CLEAR+ Member Usage was 7.1x. First quarter 2025 Annual CLEAR+ Gross Dollar Retention was 87.1%, down 140 basis points sequentially, driven by the step-function price increases from 2023 and 2024. General Airline pricing increased from $119 to $189, and Family doubled from $60 to $119 since 2023. These price increases had the greatest impact on Gross Dollar Retention throughout 2024, and are now beginning to normalize. Cost of revenue share fee was $29.6 million in the first quarter of 2025. Cost of revenue share fee as a percentage of revenue was up 40 basis points year-over-year. Cost of direct salaries and benefits was $50.7 million in the first quarter of 2025. Cost of direct salaries and benefits as a percentage of revenue was up 150 basis points year-over-year. This increase reflects the first full quarter under our new Ambassador compensation structure, which shifted to higher base salaries and lower commissions. Additionally, this increase reflects the impact of new TSA PreCheck® Flagship locations. Research and development expense was $19.0 million in the first quarter of 2025. Research and development expense as a percentage of revenue was down 220 basis points year-over-year. Sales and marketing expense was $13.4 million in the first quarter of 2025. Sales and marketing expense as a percentage of revenue was down 20 basis points. First quarter 2025 figures benefited from our new Ambassador compensation structure as described above. General and administrative expense was $54.7 million in the first quarter of 2025. General and administrative expense as a percentage of revenue was down 360 basis points. Stock compensation expense was $7.8 million in the first quarter of 2025. Stock compensation as a percentage of revenue was down 230 basis points year-over-year. First Quarter 2025 Financial Discussion
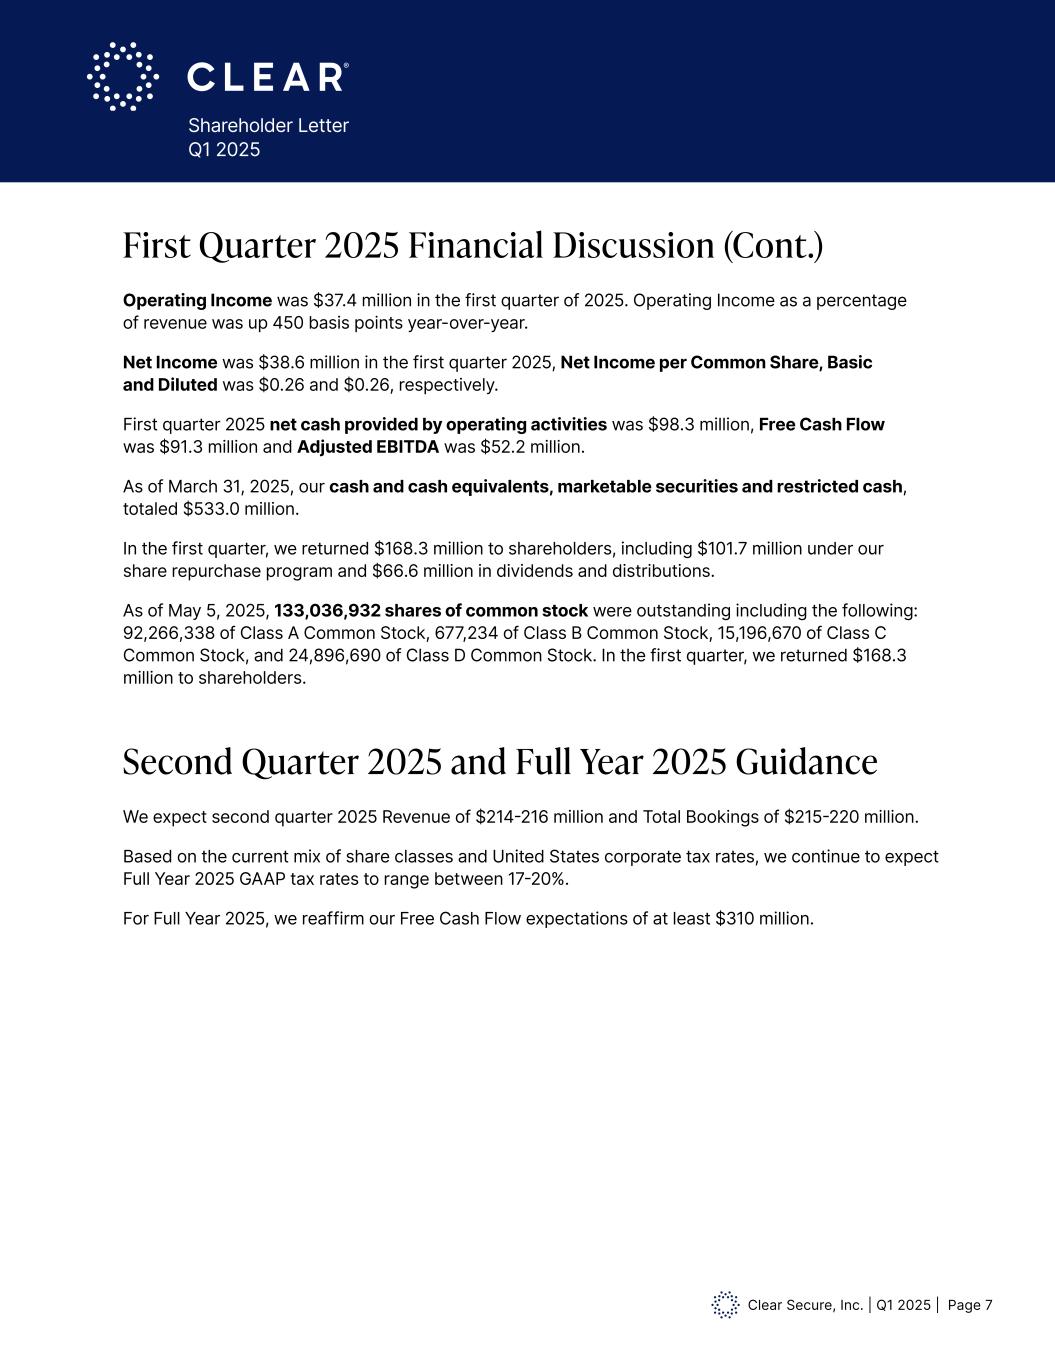
Clear Secure, Inc. | Q1 2025 | Page 7 Shareholder Letter Q1 2025 Operating Income was $37.4 million in the first quarter of 2025. Operating Income as a percentage of revenue was up 450 basis points year-over-year. Net Income was $38.6 million in the first quarter 2025, Net Income per Common Share, Basic and Diluted was $0.26 and $0.26, respectively. First quarter 2025 net cash provided by operating activities was $98.3 million, Free Cash Flow was $91.3 million and Adjusted EBITDA was $52.2 million. As of March 31, 2025, our cash and cash equivalents, marketable securities and restricted cash, totaled $533.0 million. In the first quarter, we returned $168.3 million to shareholders, including $101.7 million under our share repurchase program and $66.6 million in dividends and distributions. As of May 5, 2025, 133,036,932 shares of common stock were outstanding including the following: 92,266,338 of Class A Common Stock, 677,234 of Class B Common Stock, 15,196,670 of Class C Common Stock, and 24,896,690 of Class D Common Stock. In the first quarter, we returned $168.3 million to shareholders. First Quarter 2025 Financial Discussion (Cont.) Second Quarter 2025 and Full Year 2025 Guidance We expect second quarter 2025 Revenue of $214-216 million and Total Bookings of $215-220 million. Based on the current mix of share classes and United States corporate tax rates, we continue to expect Full Year 2025 GAAP tax rates to range between 17-20%. For Full Year 2025, we reaffirm our Free Cash Flow expectations of at least $310 million.
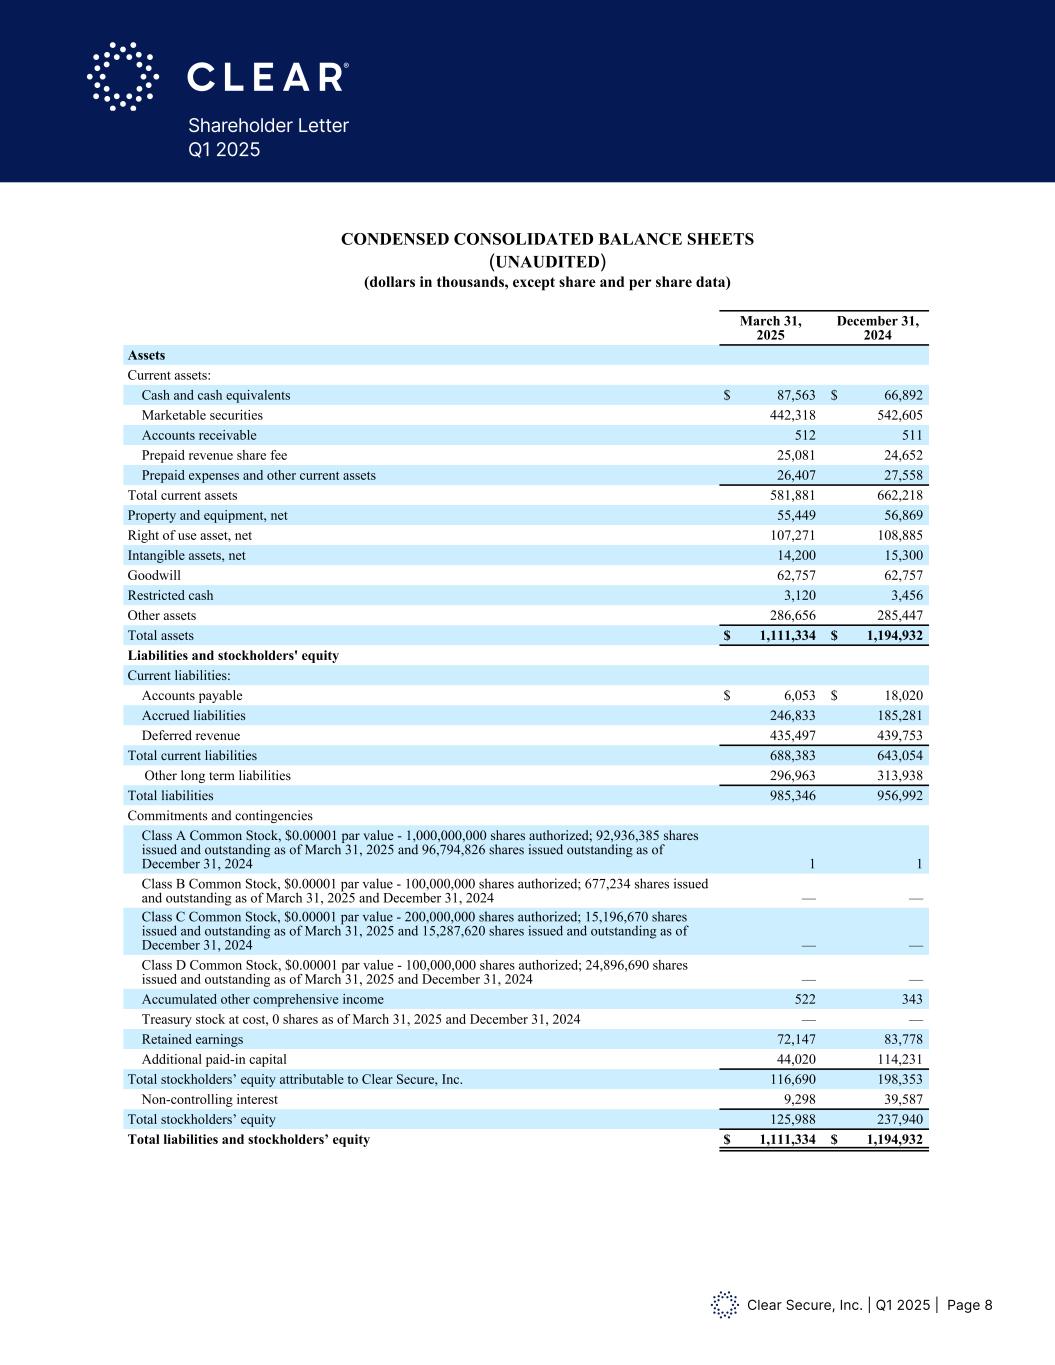
Clear Secure, Inc. | Q1 2025 | Page 8 Shareholder Letter Q1 2025 CLEAR SECURE, INC. CONDENSED CONSOLIDATED BALANCE SHEETS (UNAUDITED) (dollars in thousands, except share and per share data) March 31, 2025 December 31, 2024 Assets Current assets: Cash and cash equivalents $ 87,563 $ 66,892 Marketable securities 442,318 542,605 Accounts receivable 512 511 Prepaid revenue share fee 25,081 24,652 Prepaid expenses and other current assets 26,407 27,558 Total current assets 581,881 662,218 Property and equipment, net 55,449 56,869 Right of use asset, net 107,271 108,885 Intangible assets, net 14,200 15,300 Goodwill 62,757 62,757 Restricted cash 3,120 3,456 Other assets 286,656 285,447 Total assets $ 1,111,334 $ 1,194,932 Liabilities and stockholders' equity Current liabilities: Accounts payable $ 6,053 $ 18,020 Accrued liabilities 246,833 185,281 Deferred revenue 435,497 439,753 Total current liabilities 688,383 643,054 Other long term liabilities 296,963 313,938 Total liabilities 985,346 956,992 Commitments and contingencies (Note 16) Class A Common Stock, $0.00001 par value - 1,000,000,000 shares authorized; 92,936,385 shares issued and outstanding as of March 31, 2025 and 96,794,826 shares issued outstanding as of December 31, 2024 1 1 Class B Common Stock, $0.00001 par value - 100,000,000 shares authorized; 677,234 shares issued and outstanding as of March 31, 2025 and December 31, 2024 — — Class C Common Stock, $0.00001 par value - 200,000,000 shares authorized; 15,196,670 shares issued and outstanding as of March 31, 2025 and 15,287,620 shares issued and outstanding as of December 31, 2024 — — Class D Common Stock, $0.00001 par value - 100,000,000 shares authorized; 24,896,690 shares issued and outstanding as of March 31, 2025 and December 31, 2024 — — Accumulated other comprehensive income 522 343 Treasury stock at cost, 0 shares as of March 31, 2025 and December 31, 2024 — — Retained earnings 72,147 83,778 Additional paid-in capital 44,020 114,231 Total stockholders’ equity attributable to Clear Secure, Inc. 116,690 198,353 Non-controlling interest 9,298 39,587 Total stockholders’ equity 125,988 237,940 Total liabilities and stockholders’ equity $ 1,111,334 $ 1,194,932
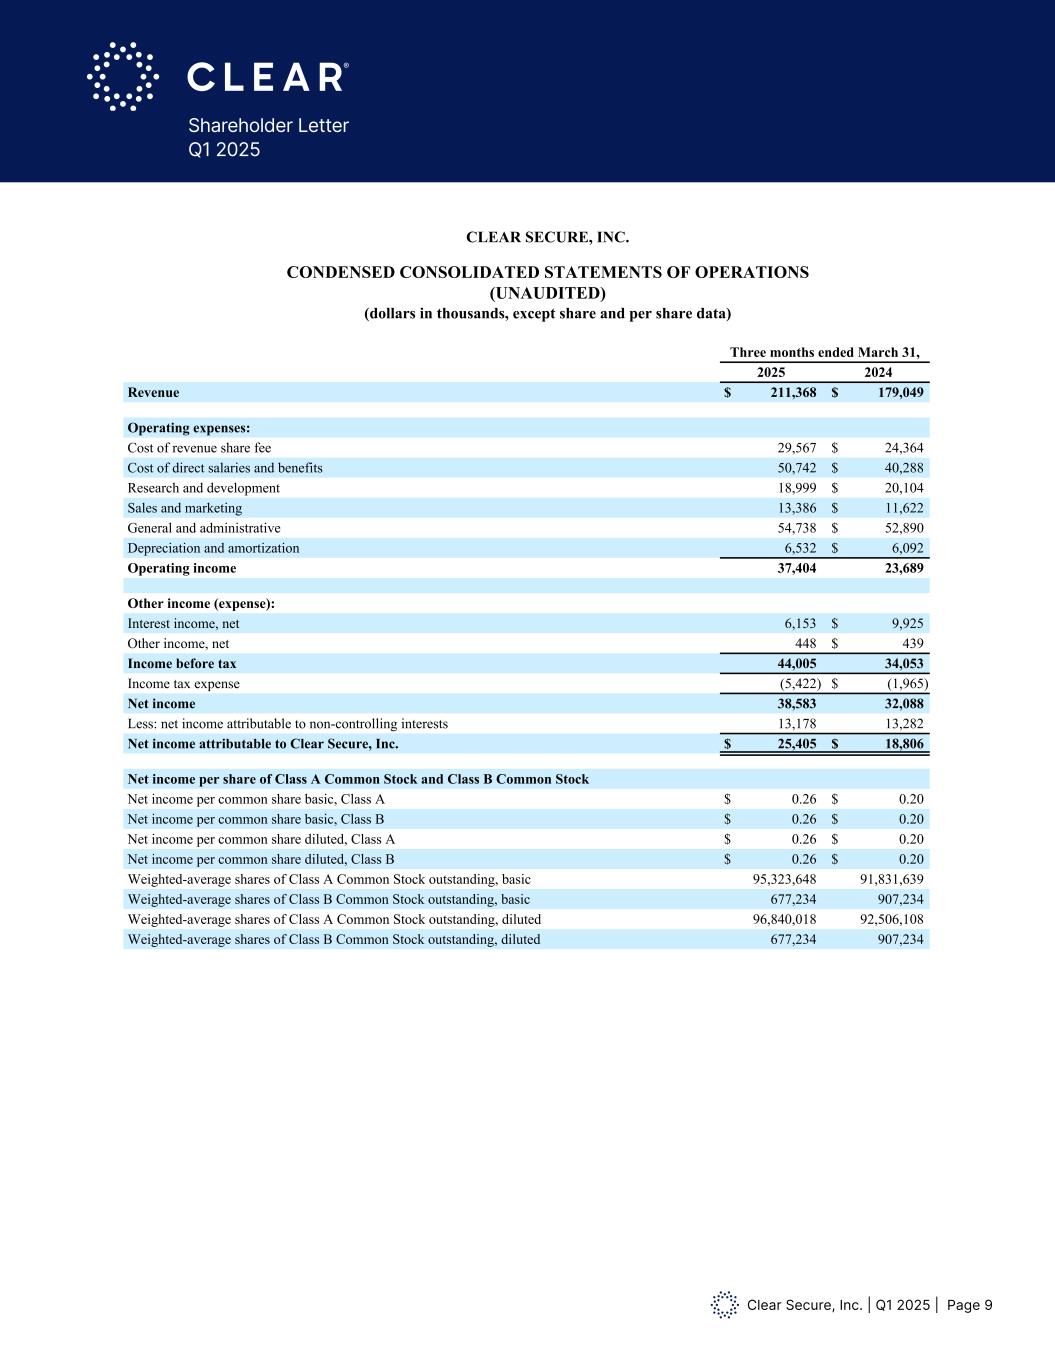
Clear Secure, Inc. | Q1 2025 | Page 9 Shareholder Letter Q1 2025 CLEAR SECURE, INC. CONDENSED CONSOLIDATED STATEMENTS OF OPERATIONS (UNAUDITED) (dollars in thousands, except share and per share data) Three months ended March 31, 2025 2024 Revenue $ 211,368 $ 179,049 Operating expenses: Cost of revenue share fee 29,567 $ 24,364 Cost of direct salaries and benefits 50,742 $ 40,288 Research and development 18,999 $ 20,104 Sales and marketing 13,386 $ 11,622 General and administrative 54,738 $ 52,890 Depreciation and amortization 6,532 $ 6,092 Operating income 37,404 23,689 Other income (expense): Interest income, net 6,153 $ 9,925 Other income, net 448 $ 439 Income before tax 44,005 34,053 Income tax expense (5,422) $ (1,965) Net income 38,583 32,088 Less: net income attributable to non-controlling interests 13,178 13,282 Net income attributable to Clear Secure, Inc. $ 25,405 $ 18,806 Net income per share of Class A Common Stock and Class B Common Stock (Note 14) Net income per common share basic, Class A $ 0.26 $ 0.20 Net income per common share basic, Class B $ 0.26 $ 0.20 Net income per common share diluted, Class A $ 0.26 $ 0.20 Net income per common share diluted, Class B $ 0.26 $ 0.20 Weighted-average shares of Class A Common Stock outstanding, basic 95,323,648 91,831,639 Weighted-average shares of Class B Common Stock outstanding, basic 677,234 907,234 Weighted-average shares of Class A Common Stock outstanding, diluted 96,840,018 92,506,108 Weighted-average shares of Class B Common Stock outstanding, diluted 677,234 907,234 CLEAR SECURE, INC. CONDENSED CONSOLIDATED STATEMEN S OF OPERATIONS (UNAUDITED) (dollars in thousands, except share and er share data) Three months end d March 31, 2025 2024 Revenue $ 211,368 $ 179,049 Operating expens s: Cost of revenue share fe 29,567 $ 24,364 Cost of direct salaries and benefits 50,742 $ 40,288 Research and development 18,999 $ 20,104 Sales and marketing 13,386 $ 11,622 General and admi istrative 54,738 $ 52,890 Depreciation and amortization 6,532 $ 6,092 Operating income 37,404 23,689 Other income (expense): Interest income, n t 6,153 $ 9,925 Other income, net 448 $ 439 Income before tax 44,005 34,053 Income tax expense (5,422) $ (1,965) Net income 38,583 32,088 Less: net income attributable to non-controlling interests 13,178 13,282 Net income attributable to Clear Secure, Inc. $ 25,405 $ 18,806 Net income per share of Class A Common Stock and Class B Common Stock (Note 14) Net income per comm n share basic, Class A $ 0.26 $ 0.20 Net income per comm n share basic, Class B $ 0.26 $ 0.20 Net income per comm n share diluted, Class A $ 0.26 $ 0.20 Net income per comm n share diluted, Class B $ 0.26 $ 0.20 Weighted-average shares of Class A Common Stock outstanding, basic 95,323,648 91,831,639 Weighted-average shares of Class B Common Stock outstanding, basic 677,234 907,234 Weighted-average shares of Class A Common Stock outstanding, diluted 96,840,018 92,506,108 Weighted-average shares of Class B Common Stock outstanding, diluted 677,234 907,234
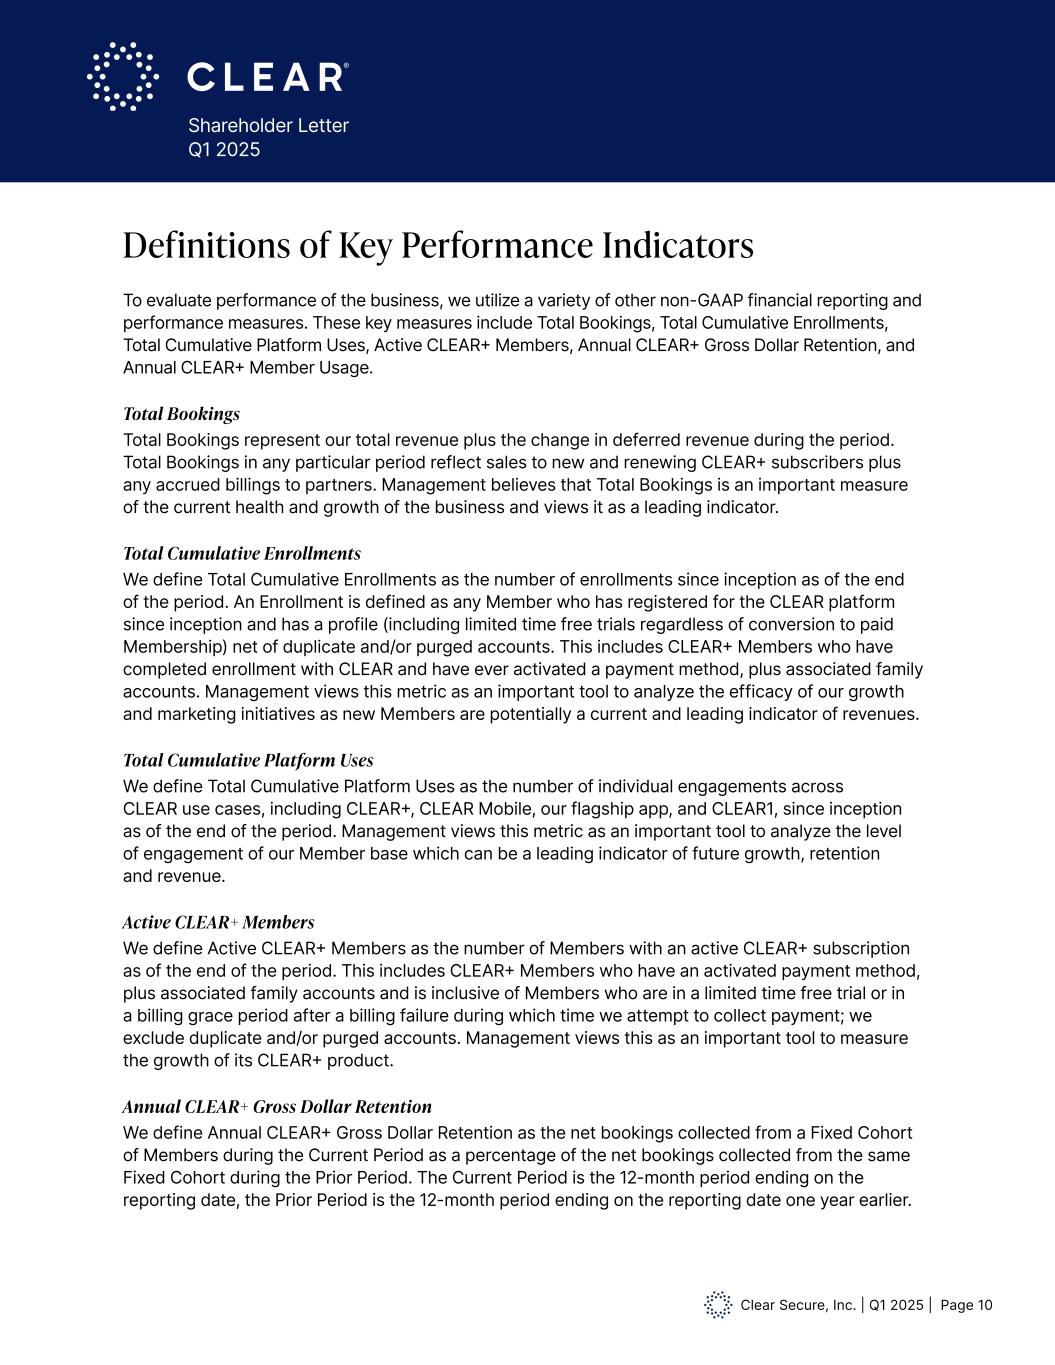
Clear Secure, Inc. | Q1 2025 | Page 10 Shareholder Letter Q1 2025 To evaluate performance of the business, we utilize a variety of other non-GAAP financial reporting and performance measures. These key measures include Total Bookings, Total Cumulative Enrollments, Total Cumulative Platform Uses, Active CLEAR+ Members, Annual CLEAR+ Gross Dollar Retention, and Annual CLEAR+ Member Usage. Total Bookings Total Bookings represent our total revenue plus the change in deferred revenue during the period. Total Bookings in any particular period reflect sales to new and renewing CLEAR+ subscribers plus any accrued billings to partners. Management believes that Total Bookings is an important measure of the current health and growth of the business and views it as a leading indicator. Total Cumulative Enrollments We define Total Cumulative Enrollments as the number of enrollments since inception as of the end of the period. An Enrollment is defined as any Member who has registered for the CLEAR platform since inception and has a profile (including limited time free trials regardless of conversion to paid Membership) net of duplicate and/or purged accounts. This includes CLEAR+ Members who have completed enrollment with CLEAR and have ever activated a payment method, plus associated family accounts. Management views this metric as an important tool to analyze the efficacy of our growth and marketing initiatives as new Members are potentially a current and leading indicator of revenues. Total Cumulative Platform Uses We define Total Cumulative Platform Uses as the number of individual engagements across CLEAR use cases, including CLEAR+, CLEAR Mobile, our flagship app, and CLEAR1, since inception as of the end of the period. Management views this metric as an important tool to analyze the level of engagement of our Member base which can be a leading indicator of future growth, retention and revenue. Active CLEAR+ Members We define Active CLEAR+ Members as the number of Members with an active CLEAR+ subscription as of the end of the period. This includes CLEAR+ Members who have an activated payment method, plus associated family accounts and is inclusive of Members who are in a limited time free trial or in a billing grace period after a billing failure during which time we attempt to collect payment; we exclude duplicate and/or purged accounts. Management views this as an important tool to measure the growth of its CLEAR+ product. Annual CLEAR+ Gross Dollar Retention We define Annual CLEAR+ Gross Dollar Retention as the net bookings collected from a Fixed Cohort of Members during the Current Period as a percentage of the net bookings collected from the same Fixed Cohort during the Prior Period. The Current Period is the 12-month period ending on the reporting date, the Prior Period is the 12-month period ending on the reporting date one year earlier. Definitions of Key Performance Indicators
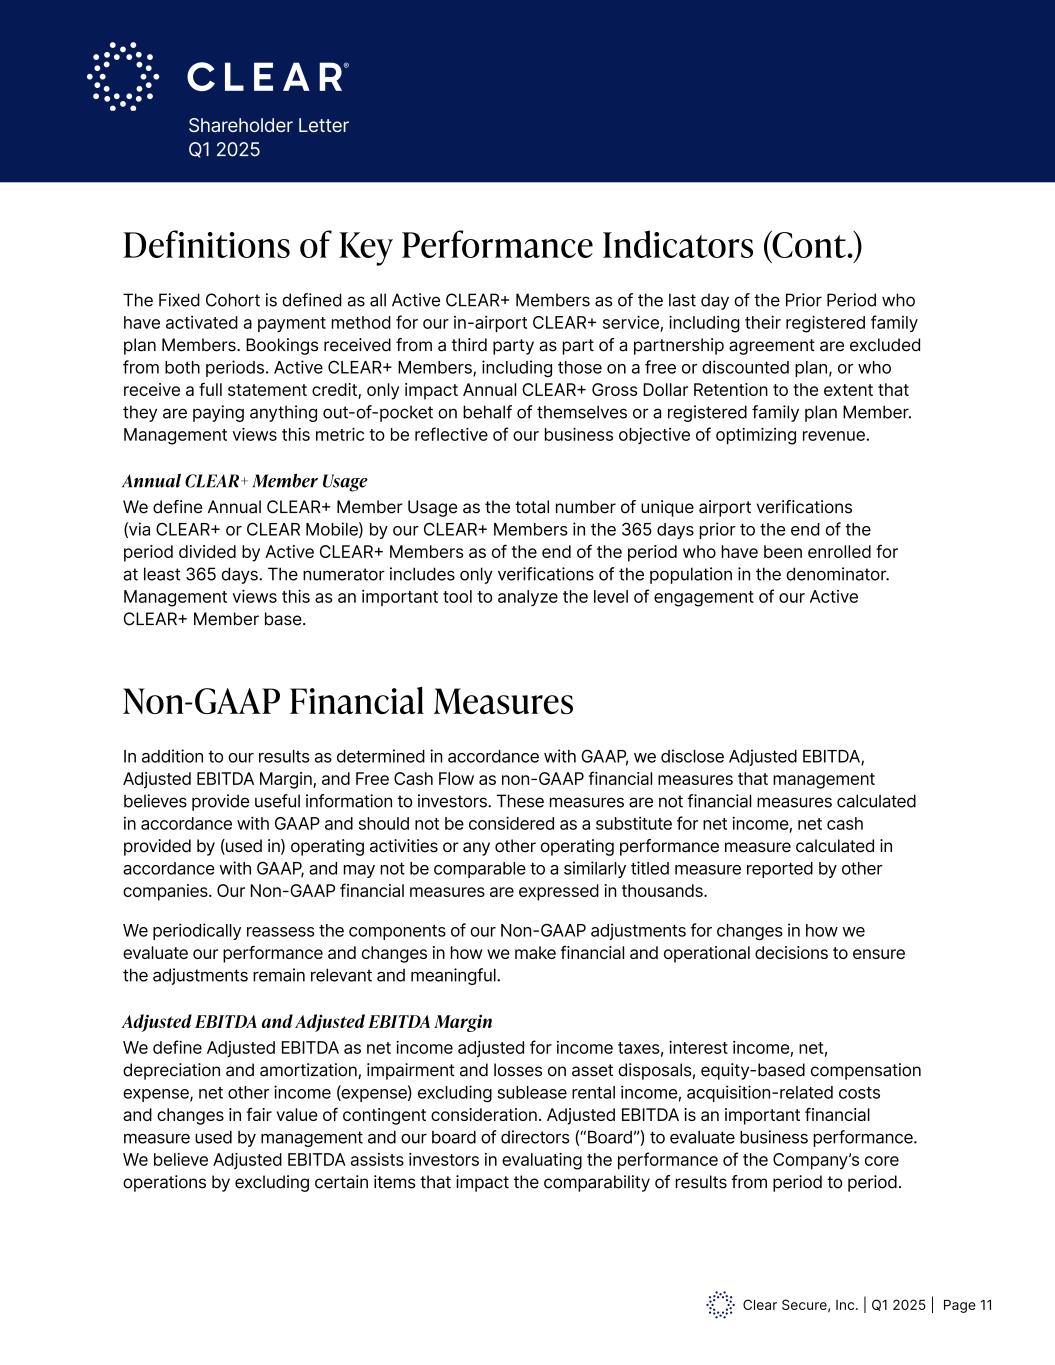
Clear Secure, Inc. | Q1 2025 | Page 11 Shareholder Letter Q1 2025 In addition to our results as determined in accordance with GAAP, we disclose Adjusted EBITDA, Adjusted EBITDA Margin, and Free Cash Flow as non-GAAP financial measures that management believes provide useful information to investors. These measures are not financial measures calculated in accordance with GAAP and should not be considered as a substitute for net income, net cash provided by (used in) operating activities or any other operating performance measure calculated in accordance with GAAP, and may not be comparable to a similarly titled measure reported by other companies. Our Non-GAAP financial measures are expressed in thousands. We periodically reassess the components of our Non-GAAP adjustments for changes in how we evaluate our performance and changes in how we make financial and operational decisions to ensure the adjustments remain relevant and meaningful. Adjusted EBITDA and Adjusted EBITDA Margin We define Adjusted EBITDA as net income adjusted for income taxes, interest income, net, depreciation and amortization, impairment and losses on asset disposals, equity-based compensation expense, net other income (expense) excluding sublease rental income, acquisition-related costs and changes in fair value of contingent consideration. Adjusted EBITDA is an important financial measure used by management and our board of directors (“Board”) to evaluate business performance. We believe Adjusted EBITDA assists investors in evaluating the performance of the Company’s core operations by excluding certain items that impact the comparability of results from period to period. Non-GAAP Financial Measures The Fixed Cohort is defined as all Active CLEAR+ Members as of the last day of the Prior Period who have activated a payment method for our in-airport CLEAR+ service, including their registered family plan Members. Bookings received from a third party as part of a partnership agreement are excluded from both periods. Active CLEAR+ Members, including those on a free or discounted plan, or who receive a full statement credit, only impact Annual CLEAR+ Gross Dollar Retention to the extent that they are paying anything out-of-pocket on behalf of themselves or a registered family plan Member. Management views this metric to be reflective of our business objective of optimizing revenue. Annual CLEAR+ Member Usage We define Annual CLEAR+ Member Usage as the total number of unique airport verifications (via CLEAR+ or CLEAR Mobile) by our CLEAR+ Members in the 365 days prior to the end of the period divided by Active CLEAR+ Members as of the end of the period who have been enrolled for at least 365 days. The numerator includes only verifications of the population in the denominator. Management views this as an important tool to analyze the level of engagement of our Active CLEAR+ Member base. Definitions of Key Performance Indicators (Cont.)
Clear Secure, Inc. | Q1 2025 | Page 12 Shareholder Letter Q1 2025 Free Cash Flow We define Free Cash Flow as net cash provided by operating activities adjusted for purchases of property and equipment. With regards to our CLEAR+ subscription service, we generally collect cash from our Members upfront for annual subscriptions. As a result, when the business is growing Free Cash Flow can be a real time indicator of the current trajectory of the business. See below for reconciliations of these non-GAAP financial measures to their most comparable GAAP measures. Non-GAAP Financial Measures (Cont.) Forward-Looking Statements This release may contain statements that constitute forward-looking statements within the meaning of the Private Securities Litigation Reform Act of 1995. Investors are cautioned that any and such forward looking statement are not guarantees of future performance or results and involve risks and uncertainties, and that actual results, developments and events may differ materially from those in the forward-looking statements as a result of various factors, including those described in the Company’s filings with the Securities and Exchange Commission, including the sections titled “Risk Factors” in our Annual Report on Form 10-K. The Company disclaims any obligation to update any forward looking statements contained herein.
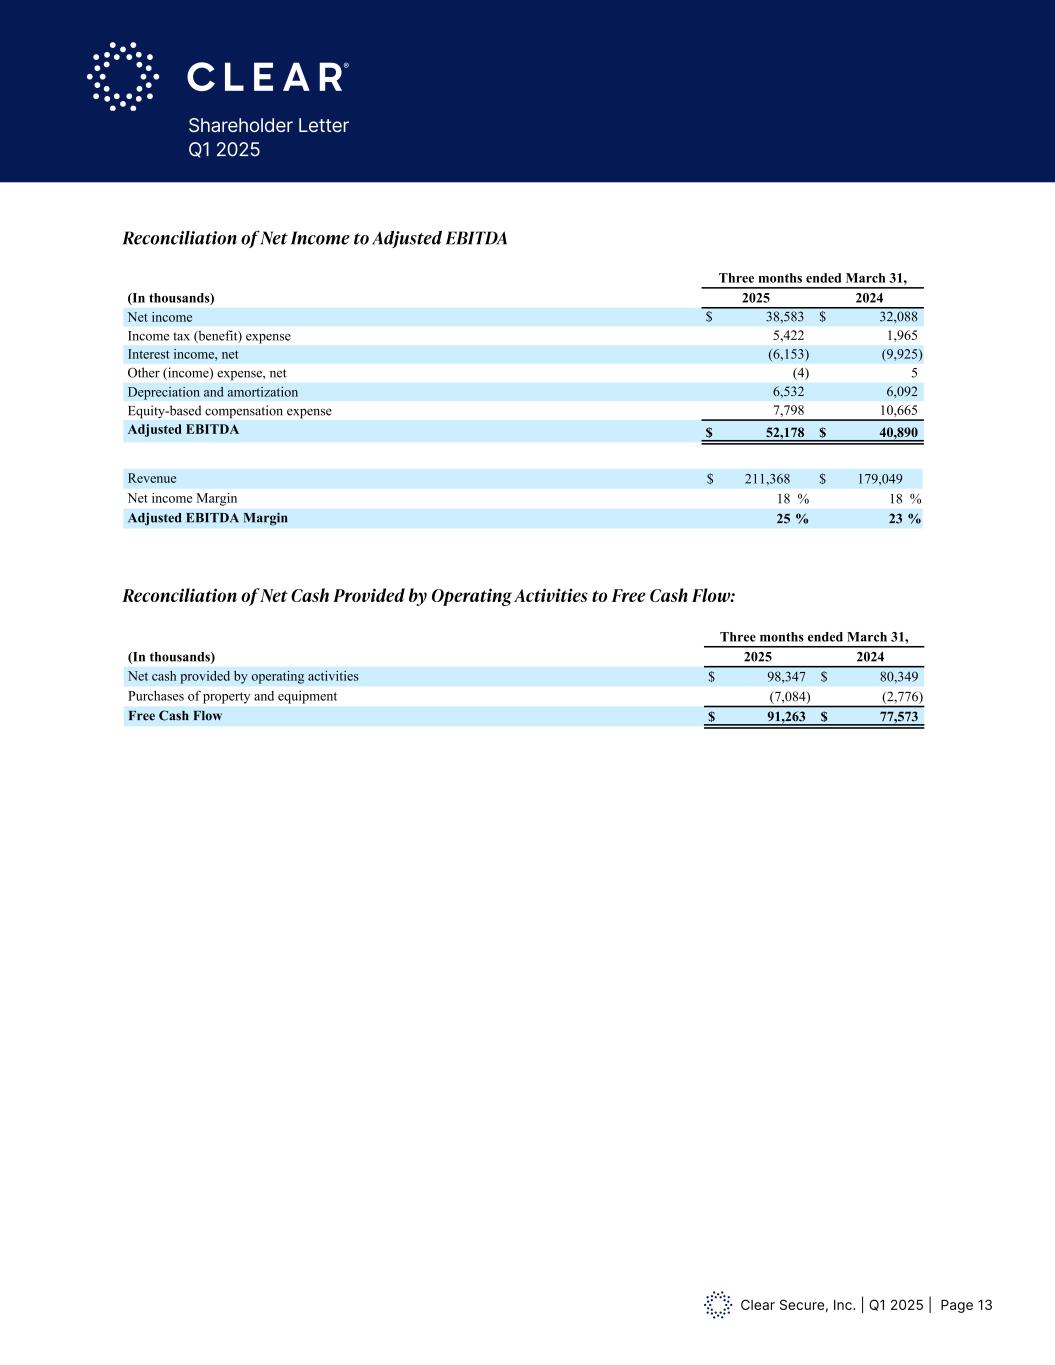
Clear Secure, Inc. | Q1 2025 | Page 13 Shareholder Letter Q1 2025 Non-GAAP Financial Measures In addition to our results as determined in accordance with GAAP, we disclose Adjusted EBITDA, Adjusted EBITDA Margin, and Free Cash Flow as non-GAAP financial measures that management believes provide useful information to investors. These measures are not financial measures calculated in accordance with GAAP and should not be considered as a substitute for net income, net cash provided by (used in) operating activities or any other operating performance measure calculated in accordance with GAAP, and may not be comparable to a similarly titled measure reported by other companies. Our Non-GAAP financial measures are expressed in thousands. We periodically reassess the components of our Non-GAAP adjustments for changes in how we evaluate our performance and changes in how we make financial and operational decisions to ensure the adjustments remain relevant and meaningful. Adjusted EBITDA and Adjusted EBITDA Margin We define Adjusted EBITDA as net income adjusted for income taxes, interest income, net, depreciation and amortization, impairment and losses on asset disposals, equity-based compensation expense, net other income (expense) excluding sublease rental income, acquisition-related costs and changes in fair value of contingent consideration. Adjusted EBITDA is an important financial measure used by management and our board of directors (“Board”) to evaluate business performance. We believe Adjusted EBITDA assists investors in evaluating the performance of the Company’s core operations by excluding certain items that impact the comparability of results from period to period. Free Cash Flow We define Free Cash Flow as net cash provided by operating activities adjusted for purchases of property and equipment plus the value of share repurchases over fair value. With regards to our CLEAR + subscription service, we generally collect cash from our members upfront for annual subscriptions. As a result, when the business is growing Free Cash Flow can be a real time indicator of the current trajectory of the business. See below for reconciliations of these non-GAAP financial measures to their most comparable GAAP measures. Forward-Looking Statements This release may contain statements that constitute forward-looking statements within the meaning of the Private Securities Litigation Reform Act of 1995. Investors are cautioned that any and such forward looking statement are not guarantees of future performance or results and involve risks and uncertainties, and that actual results, developments and events may differ materially from those in the forward-looking statements as a result of various factors, including those described in the Company’s filings with the Securities and Exchange Commission, including the sections titled “Risk Factors” in our Annual Report on Form 10-K for the year ended December 31, 2024. The Company disclaims any obligation to update any forward looking statements contained herein. Reconciliation of Net Income to Adjusted EBITDA: Three months ended March 31, (In thousands) 2025 2024 Net income $ 38,583 $ 32,088 Income tax (benefit) expense 5,422 1,965 Interest income, net (6,153) (9,925) Other (income) expense, net (4) 5 Depreciation and amortization 6,532 6,092 Equity-based compensation expense 7,798 10,665 Adjusted EBITDA $ 52,178 $ 40,890 Revenue $ 211,368 $ 179,049 Net income Margin 18 % 18 % Adjusted EBITDA Margin 25 % 23 % Reconciliation of Net Cash Provided by Operating Activities to Free Cash Flow: Three months ended March 31, (In thousands) 2025 2024 Net cash provided by operating activities $ 98,347 $ 80,349 Purchases of property and equipment (7,084) (2,776) Free Cash Flow $ 91,263 $ 77,573 Reconciliation of Net Income to Adjusted EBITDA Reconciliation of Net Cash Provided by Operating Activities to Free Cash Flow:
