
Shareholder Letter Q3 2024
Clear Secure, Inc. | Q3 2024 | Page 2 Shareholder Letter Q3 2024 Third Quarter 2024 Financial Highlights (all figures are for Third Quarter 2024 and percentage change is expressed as year-over-year, unless otherwise specified)* Revenue of $198.4 million was up 23.7% while Total Bookings of $227.5 million were up 18.7% Operating income of $35.1 million; Adjusted EBITDA of $48.6 million Net Income of $38.0 million, Earnings per Common Share Basic and Diluted of $0.25 Net cash provided by operating activities of $(35.9) million; Free Cash Flow of $(37.9) million; both figures reflect the annual outflow to our credit card partner of ~$182 million Repurchased 4 million shares (previously disclosed) Active in 58 CLEAR Plus airports TSA PreCheck® Enrollment Provided by CLEAR live in 52 airports nationwide and 10 Staples Locations * A reconciliation of non-GAAP financial measures to the most comparable GAAP measures is provided at the end of this letter. “ A verified identity isn’t just a checkmark; it’s the foundation for everything we do in a high stakes digital world. Third quarter financial performance was strong with Bookings growth re-accelerating to 19% and +50% incremental margins,” said Caryn Seidman Becker, CLEAR’s CEO
Clear Secure, Inc. | Q3 2024 | Page 3 Shareholder Letter Q3 2024 8.5x 8.1x 7.8x 7.4x Q3 '23 Q4 '23 Q1 '24 Q2 '24 2024 Annualized CLEAR Plus Member Usage 88.5% 86.3% Q3 '23 Q4 '23 Annual CLEAR Plus Net Member Retention 6,374 6,720 Q3 '23 Q4 '23 Acitve CLEAR Plus Members (Thousands) $160.4 $171.0 $179.0 $186.7 $198.4 $191.7 $195.3 $180.6 $197.0 $227.5 Q3 '23 Q4 '23 Q1 '24 Q2 '24 Q3 '24 2024 Total GAAP Revenue & Bookings Revenue Total Bookings 18,594 20,194 Q3 '23 Q4 '23 Total Cumulative Enrollments (Thousands) 167,417 180,807 192,610 206,673 220,413 Q3 '23 Q4 '23 Q1 '24 Q2 '24 Q3 '24 2024 Total Cumulative Platform Uses (Thousands) 88.0% 89.3% 89.8% 89.3% 89.0% Q3 '23 Q4 '23 Q1 '24 Q2 '24 Q3 '24 2024 Annual CLEAR Plus Gross Dollar Retention 88.5% 86.3% 84.0% 83.2% 81.5% Q3 '23 Q4 '23 Q1 '24 Q2 '24 Q3 '24 2024 Annual CLEAR Plus Net Member Retention 6,374 6,720 6,798 7,095 7,150 Q3 '23 Q4 '23 Q1 '24 Q2 '24 Q3 '24 2024 Acitve CLEAR Plus Members (Thousands) $227.5 18,594 20,194 21,941 24,221 26,453 Q3 '23 Q4 '23 Q1 '24 Q2 '24 Q3 '24 2024 Total Cumulative Enrollments (Thousands) in millions 2023 2023 in thousands Total GAAP Revenue & Bookings Total Cumulative Enrollments
Clear Secure, Inc. | Q3 2024 | Page 4 Shareholder Letter Q3 2024 Total Cumulative Platform Uses 8.5x 8.1x 7.8x 7.4x Q3 '23 Q4 '23 Q1 '24 Q2 '24 2024 Annualized CLEAR Plus Member Usage 88.5% 86.3% Q3 '23 Q4 '23 Annual CLEAR Plus Net Member Retention 6,374 6,720 Q3 '23 Q4 '23 Acitve CLEAR Plus Members (Thousands) $160.4 $171.0 $179.0 $186.7 $198.4 $191.7 $195.3 $180.6 $197.0 $227.5 Q3 '23 Q4 '23 Q1 '24 Q2 '24 Q3 '24 2024 Total GAAP Revenue & Bookings Revenue Total Bookings 18,594 20,194 Q3 '23 Q4 '23 Total Cumulative Enrollments (Thousands) 167,417 180,807 192,610 206,673 220,413 Q3 '23 Q4 '23 Q1 '24 Q2 '24 Q3 '24 2024 Total Cumulative Platform Uses (Thousands) 88.0% 89.3% 89.8% 89.3% 89.0% Q3 '23 Q4 '23 Q1 '24 Q2 '24 Q3 '24 2024 Annual CLEAR Plus Gross Dollar Retentionin thousands Active CLEAR Plus Members $149.9 $160.4 $171.0 $179.0 $186.7 $175.1 $191.7 $195.3 $180.6 $197.0 Q2 '23 Q3 '23 Q4 '23 Q1 '24 Q2 '24 2023 2024 Total GAAP Revenue & Bookings Revenue Total Bookings 17,385 18,594 20,194 21,9 1 24,211 Q2 '23 Q3 '23 Q4 '23 Q1 '24 Q2 '24 2023 2024 Total Cumulative Enrollments (Thousands) 154,317 167,417 180,807 192,610 206,673 Q2 '23 Q3 '23 Q4 '23 Q1 '24 Q2 '24 2023 2024 Total Cumulative Platform Uses (Thousands) Annual CLEAR Plus Gross Dollar Retention 88.5% 86.3% 84.0% 83.2% 81.5% Q3 '23 Q4 '23 Q1 '24 Q2 '24 Q3 '24 2024 Annual CLEAR Plus Net Member Retention 6,374 6,720 6,798 7,095 7,150 3 ' 3 4 '23 Q1 '24 Q2 '24 Q3 '24 2024 Acitve CLEAR Plus Members (Thousands) $227.5 18,594 20,194 21,941 24,221 26,453 Q3 '23 Q4 '23 Q1 '24 Q2 '24 Q3 '24 2024 Total Cumulative Enrollments (Thousands) in thousands 2023 2023
Clear Secure, Inc. | Q3 2024 | Page 5 Shareholder Letter Q3 2024 8.5x 8.1x 7.8x 7.4x Q3 '23 Q4 '23 Q1 '24 Q2 '24 2024 Annualized CLEAR Plus Member Usage 88.5% 86.3% Q3 '23 Q4 '23 Annual CLEAR Plus Net Member Retention 6,374 6,720 Q3 '23 Q4 '23 Acitve CLEAR Plus Members (Thousands) $160.4 $171.0 $179.0 $186.7 $198.4 $191.7 $195.3 $180.6 $197.0 $227.5 Q3 '23 Q4 '23 Q1 '24 Q2 '24 Q3 '24 2024 Total GAAP Revenue & Bookings Revenue Total Bookings 18,594 20,194 Q3 '23 Q4 '23 Total Cumulative Enrollments (Thousands) 167,417 180,807 192,610 206,673 220,413 Q3 '23 Q4 '23 Q1 '24 Q2 '24 Q3 '24 2024 Total Cumulative Platform Uses (Thousands) 88.0% 89.3% 89.8% 89.3% 89.0% Q3 '23 Q4 '23 Q1 '24 Q2 '24 Q3 '24 2024 Annual CLEAR Plus Gross Dollar Retention Annual CLEAR Plus Gross Dollar Retention 88.5% 86.3% 84.0% 83.2% 81.5% Q3 '23 Q4 '23 Q1 '24 Q2 '24 Q3 '24 2024 Annual CLEAR Plus Net Member Retention 6,374 6,720 6,798 7,095 7,150 Q3 '23 Q4 '23 Q1 '24 Q2 '24 Q3 '24 2024 Acitve CLEAR Plus Members (Thousands) $227.5 18,594 20,194 21,941 24,221 26,453 Q3 '23 Q4 '23 Q1 '24 Q2 '24 Q3 '24 2024 Total Cumulative Enrollments (Thousands) Annual CLEAR Plus Net Member Retention 2023 2023
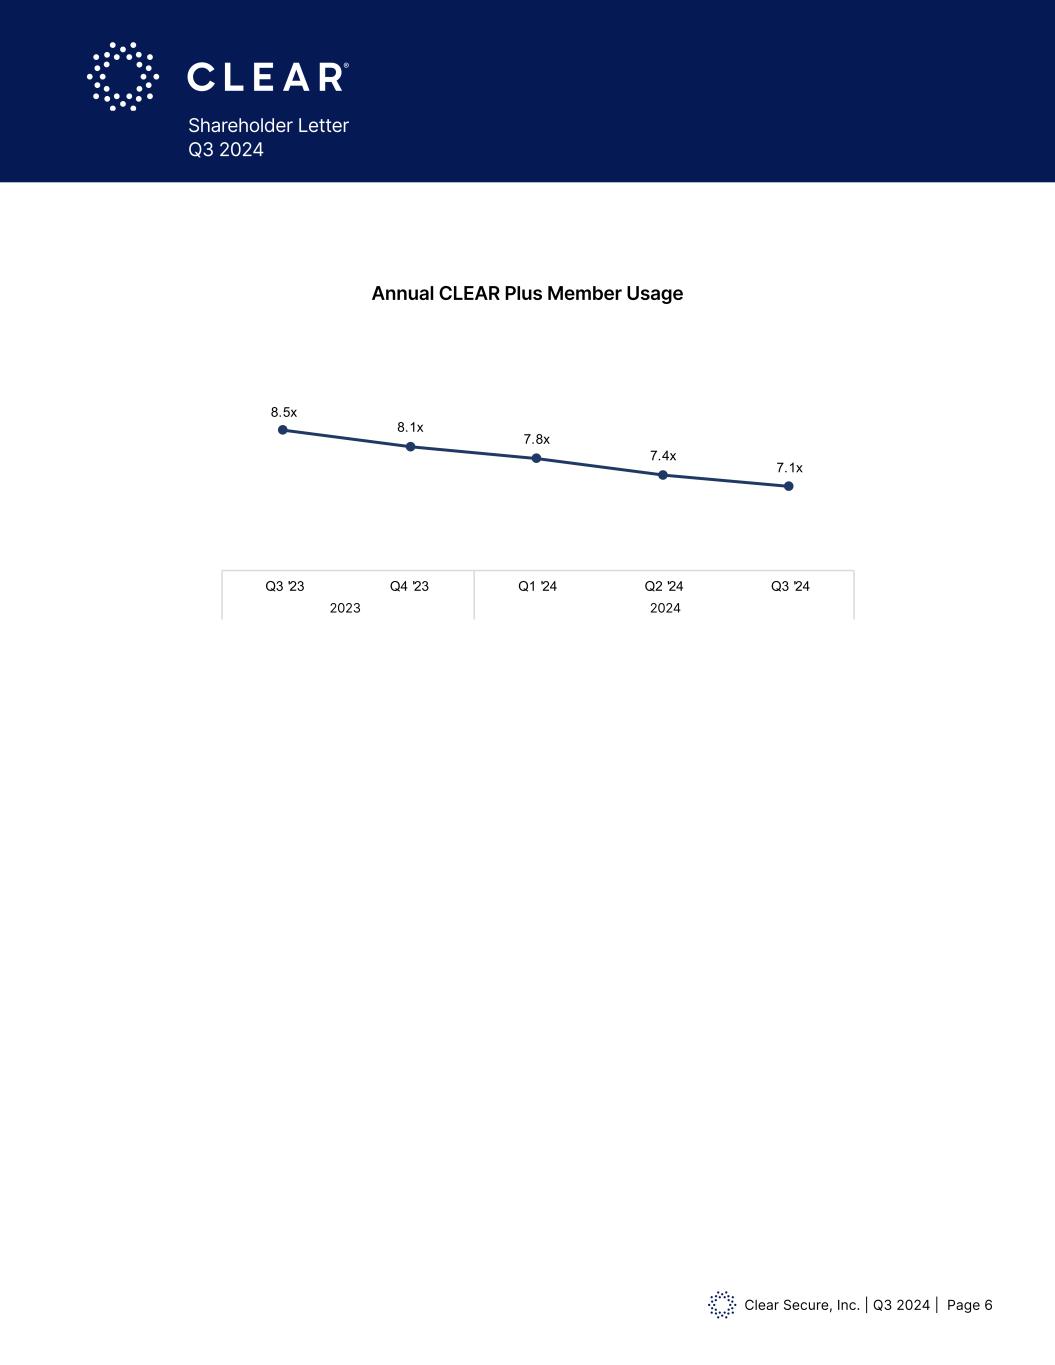
Clear Secure, Inc. | Q3 2024 | Page 6 Shareholder Letter Q3 2024 Annual CLEAR Plus Member Usage 8.5x 8.1x 7.8x 7.4x 7.1x Q3 '23 Q4 '23 Q1 '24 Q2 '24 Q3 '24 2024 Annualized CLEAR Plus Member Usage Q3 '23 Q4 '23 Q1 '24Q1 '24 Q2 '24 Q3 '24 2024 2023
Clear Secure, Inc. | Q3 2024 | Page 7 Shareholder Letter Q3 2024 Dear Shareholder, CLEAR is a secure identity network and we’re shaping the future of identity. In today’s world, the urgency for secure and frictionless experiences is the same whether it’s travel, healthcare, financial services, or retail—physically and digitally. Trusted identity—connecting you to all the things that make YOU you— is the key to safer and easier experiences for our Members and our partners. Trust and security are paramount in the increasingly digital world that we live in—ensuring true identity is critical. Identity fraud, account takeovers, and theft, along with their derivative costs are growing rapidly. The digital landscape is ever more complex, and a secure, trusted identity is not just a convenience—it’s an absolute necessity. AI is a favorite phrase right now, and at CLEAR, we see AI as a powerful tool to optimize our operations, but we are also looking at AI from a different angle—Artificial Identity. As more sensitive information is shared and accessed online, the rise of synthetic identities adds another layer of complexity. The need for accurate and secure identity verification has never been greater. CLEAR’s enterprise identity expansion continued this quarter across existing and new customers. We announced our integration with Okta, enabling enterprise clients to easily implement CLEAR’s platform for a seamless and secure biometric factor authentication—verifying the person behind the device. There is a pressing need for secure solutions in workforce identity and access particularly in regulated industries and critical infrastructure. This quarter, we launched our employee identity product with a major telecom company reflecting the need to better secure the workforce. On the consumer side, we have rolled out rider verification with Uber, helping build trust across Uber’s platform by giving their drivers peace of mind. Travel trends remain strong and we continue to see it as a secular growth industry. We expect travel spending to remain healthy and think spending on experiences will continue to be a bright spot in the economy. The CLEAR Plus Member experience continues to improve across the network. Next up, our new EnVe (enrollment and verification) hardware is rolling out across the country—Members will love our new speedy, face-first experience. Meeting travelers where they are—both inside and outside the airport—is helping drive scale for TSA PreCheck® Enrollment Provided by CLEAR. Now live in 62 locations, the consumer response is strong and we will continue to optimize the enrollment funnel, driving higher completion rates, and improved Member experience. Looking ahead to 2025, we are excited by the multi-faceted growth opportunities across our secure identity network as we continue to drive bookings, expand margins, and accelerate free cash flow. With a strong foundation in place and a clear vision for the future, CLEAR is well-positioned to continue delivering value for our Members, partners, and shareholders. Best,

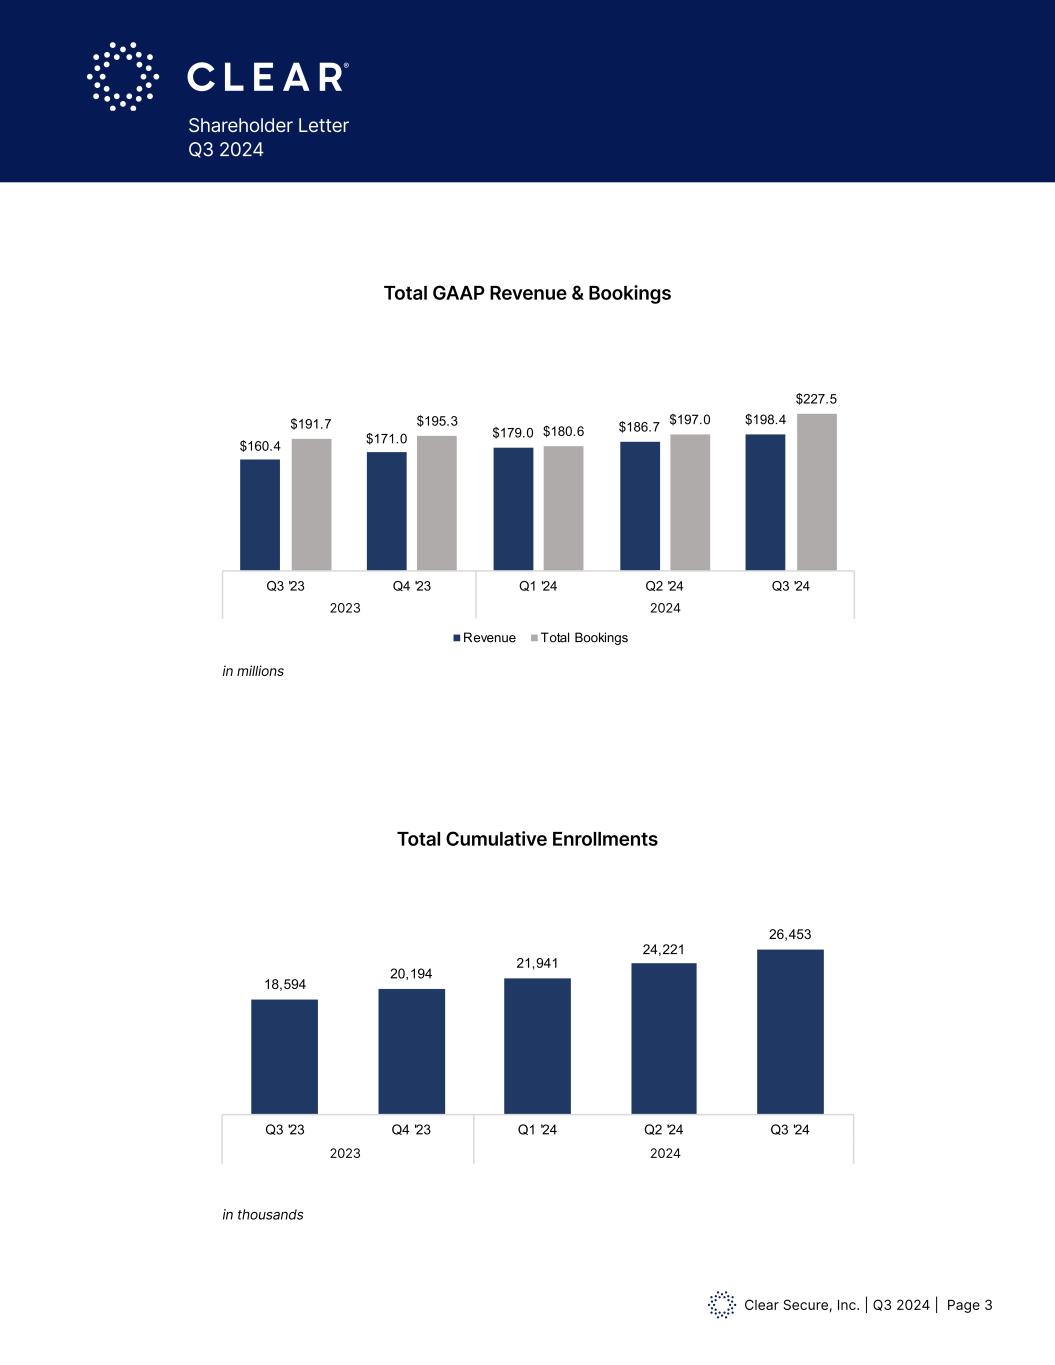
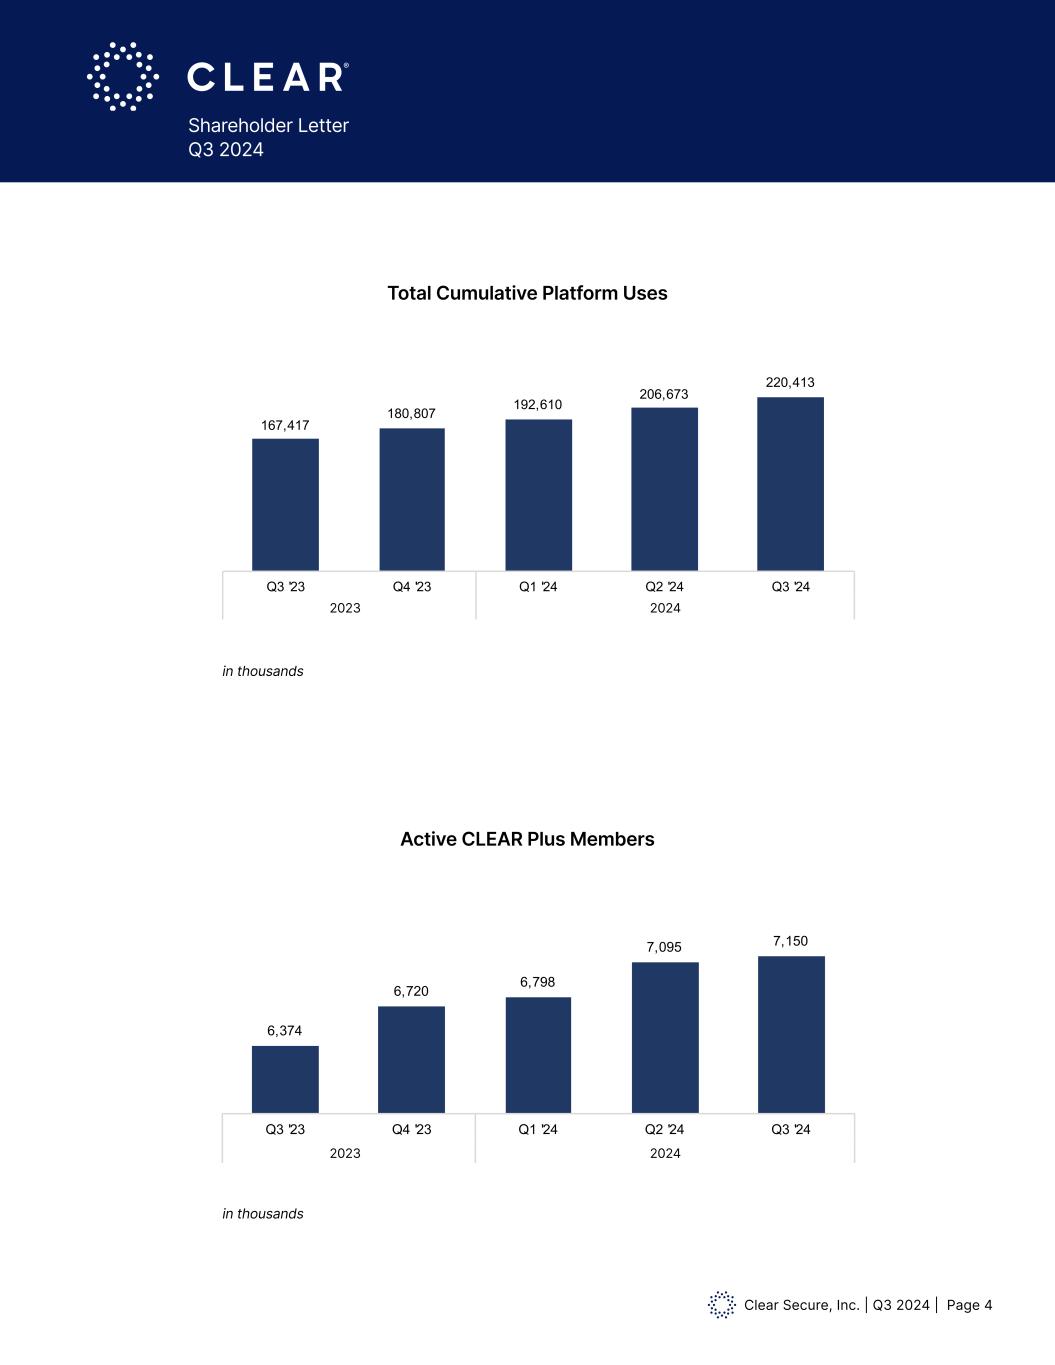
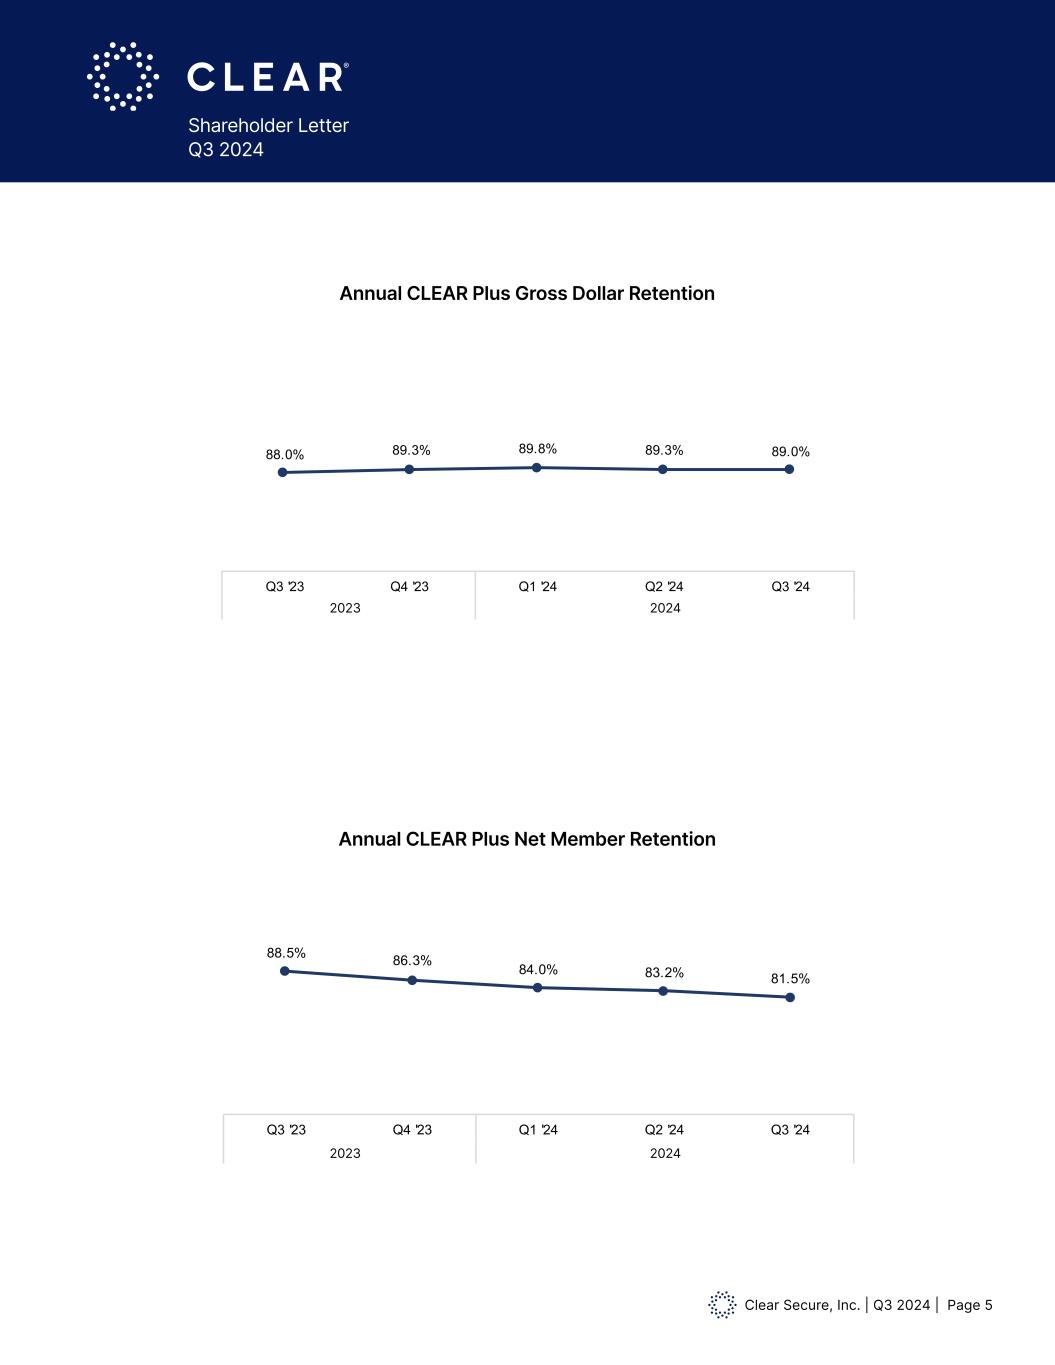
Clear Secure, Inc. | Q3 2024 | Page 8 Shareholder Letter Q3 2024 Third quarter 2024 Revenue of $198.4 million grew 23.7% as compared to the third quarter of 2023 while Total Bookings of $227.5 million grew 18.7%. These increases were driven primarily by Member growth and price increases. Third quarter 2024 Total Cumulative Enrollments reached 26.5 million, up 2.2 million sequentially driven by growth in CLEAR Verified and CLEAR Plus enrollments. Third quarter 2024 Total Cumulative Platform Uses reached 220.4 million, driven primarily by CLEAR Plus verifications as well as an increasing contribution from CLEAR Verified. Third quarter 2024 Active CLEAR Plus Members reached 7.2 million, up 12.2% as compared to the third quarter of 2023 driven by airport, partner and organic channels in existing and new markets. Third quarter 2024 Annual CLEAR Plus Gross Dollar Retention was 89.0%, up 100 basis points year-over-year and down 30 basis points sequentially. Third quarter 2024 Annual CLEAR Plus Net Member Retention was 81.5%, down 170 basis points sequentially. Third quarter 2024 Annualized CLEAR Plus Member Usage was 7.1x. Cost of revenue share fee was $28.6 million in the third quarter of 2024. Excluding previously disclosed COVID-related benefits in prior periods, cost of revenue share fee as a percentage of revenue was down 54 basis points year-over-year and up 13 basis points sequentially. Cost of revenue share fee percentage may vary by quarter, but on an annual basis we expect it to remain relatively stable over time. Cost of direct salaries and benefits was $44.8 million in the third quarter of 2024. Excluding previously disclosed prior-period non-cash items, cost of direct salaries and benefits was up 27.1% year-over-year and up 11.8% sequentially; as a percentage of revenue it was up 59 basis points year-over-year and up 113 basis points sequentially. We continue to expect cost of direct salaries and benefits in 2024 to decline as a percentage of revenue on a full year basis versus 2023. Research and development expense was $17.4 million in the third quarter of 2024. Excluding previously disclosed prior-period non-cash items, research and development expense was down 8.5% year-over-year and up 0.1% sequentially; as a percentage of revenue it was down 309 basis points year-over-year and 54 basis points sequentially. Third quarter of 2024 research and development includes a stock compensation expense reversal of $1.1 million. We continue to expect research and development expense in 2024 to decline as a percentage of revenue on a full year basis versus 2023. Sales and marketing expense was $11.6 million in the third quarter of 2024. Excluding previously disclosed prior-period non-cash items, sales and marketing expense increased 19.6% year-over-year and increased 5.5% sequentially; as a percentage of revenue it was down 20 basis points year-over- year and down 4 basis points sequentially. Third quarter of 2024 sales and marketing includes a Third Quarter 2024 Financial Discussion
Clear Secure, Inc. | Q3 2024 | Page 9 Shareholder Letter Q3 2024 stock compensation expense reversal of $0.8 million. While we continue to expect sales and marketing expense in 2024 to decline as a percentage of revenue on a full year basis versus 2023, we will invest in marketing on an opportunistic basis. General and administrative expense was $53.9 million in the third quarter of 2024. Excluding previously disclosed prior-period acquisition expenses and prior-period non-cash items, general and administrative expense declined 3.9% year-over-year and 2.6% sequentially; as a percentage of revenue, general and administrative expense was down 782 basis points year-over-year and down 248 basis points sequentially. Third quarter of 2024 general and administrative expense includes a stock compensation expense reversal of $1.0 million. We continue to expect general and administrative expense in 2024 to decline as a percentage of revenue on a full year basis versus 2023. Stock compensation expense was $6.1 million in the third quarter of 2024. Excluding previously disclosed prior-period adjustments, stock compensation was down 47.9% year-over-year and down 40.0% sequentially. Third quarter 2024 stock compensation expense includes the effects of $2.9 million of reversals. Operating income was $35.1 million in the third quarter of 2024. Excluding previously disclosed items, operating income as a percentage of revenue was up 1,082 basis points year-over-year and 175 basis points sequentially. Net Income in the third quarter 2024 was $38.0 million, Net Income per Common Share, Basic and Diluted was $0.25. Third quarter 2024 Adjusted Net Income was $42.5 million, Adjusted Net Income per Common Share, Basic and Diluted was $0.30. Third quarter 2024 net cash provided by operating activities was $(35.9) million, Free Cash Flow was $(37.9) million and Adjusted EBITDA was $48.6 million. Net cash provided by operating activities and Free Cash Flow reflect the annual outflow to our credit card partner of approximately $182 million. As of September 30, 2024, our cash and cash equivalents, marketable securities and restricted cash, totaled $548.1 million. As of November 4, 2024, 139,404,606 shares of common stock were outstanding including the following: Class A Common Stock 94,015,104, Class B Common Stock 877,234, Class C Common Stock 19,615,578, and Class D Common Stock 24,896,690. As previously disclosed, we repurchased 4.0 million shares in a block transaction in July. Third Quarter 2024 Financial Discussion (Cont.)

Clear Secure, Inc. | Q3 2024 | Page 10 Shareholder Letter Q3 2024 Fourth Quarter and Full Year 2024 Guidance We expect fourth quarter 2024 revenue of $202-$204 million and Total Bookings of $224-$226 million. For the full year of 2024, we expect to deliver expanding margins and Free Cash Flow growth of at least 40% versus 2023.
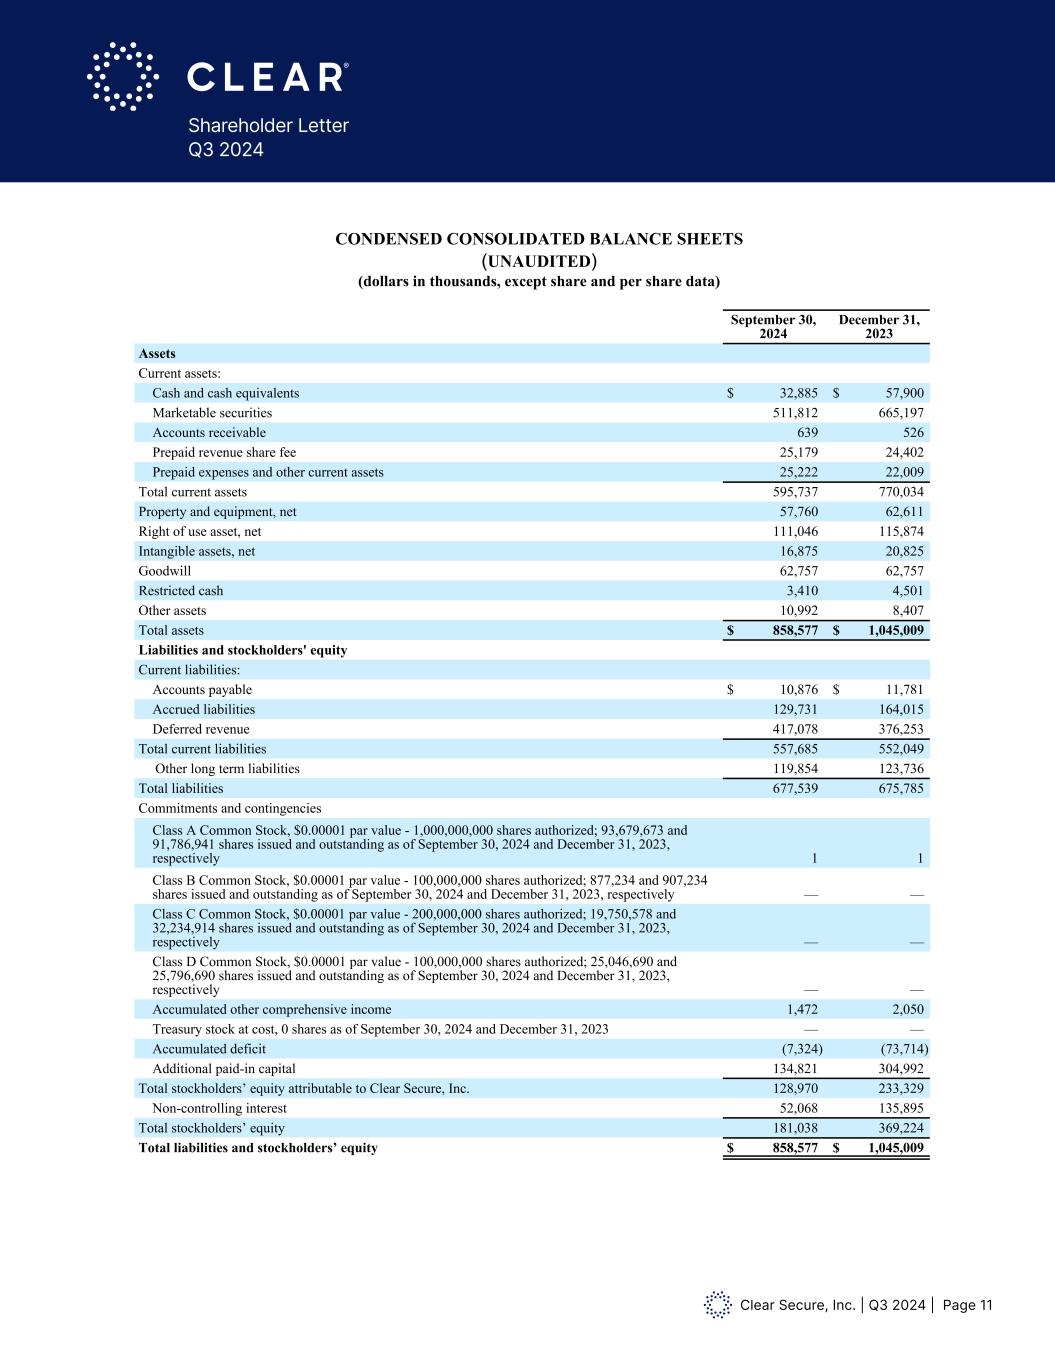
Clear Secure, Inc. | Q3 2024 | Page 11 Shareholder Letter Q3 2024 CLEAR SECURE, INC. CONDENSED CONSOLIDATED BALANCE SHEETS (UNAUDITED) (dollars in thousands, except share and per share data) September 30, 2024 December 31, 2023 Assets Current assets: Cash and cash equivalents $ 32,885 $ 57,900 Marketable securities 511,812 665,197 Accounts receivable 639 526 Prepaid revenue share fee 25,179 24,402 Prepaid expenses and other current assets 25,222 22,009 Total current assets 595,737 770,034 Property and equipment, net 57,760 62,611 Right of use asset, net 111,046 115,874 Intangible assets, net 16,875 20,825 Goodwill 62,757 62,757 Restricted cash 3,410 4,501 Other assets 10,992 8,407 Total assets $ 858,577 $ 1,045,009 Liabilities and stockholders' equity Current liabilities: Accounts payable $ 10,876 $ 11,781 Accrued liabilities 129,731 164,015 Deferred revenue 417,078 376,253 Total current liabilities 557,685 552,049 Other long term liabilities 119,854 123,736 Total liabilities 677,539 675,785 Commitments and contingencies Class A Common Stock, $0.00001 par value - 1,000,000,000 shares authorized; 93,679,673 and 91,786,941 shares issued and outstanding as of September 30, 2024 and December 31, 2023, respectively 1 1 Class B Common Stock, $0.00001 par value - 100,000,000 shares authorized; 877,234 and 907,234 shares issued and outstanding as of September 30, 2024 and December 31, 2023, respectively — — Class C Common Stock, $0.00001 par value - 200,000,000 shares authorized; 19,750,578 and 32,234,914 shares issued and outstanding as of September 30, 2024 and December 31, 2023, respectively — — Class D Common Stock, $0.00001 par value - 100,000,000 shares authorized; 25,046,690 and 25,796,690 shares issued and outstanding as of September 30, 2024 and December 31, 2023, respectively — — Accumulated other comprehensive income 1,472 2,050 Treasury stock at cost, 0 shares as of September 30, 2024 and December 31, 2023 — — Accumulated deficit (7,324) (73,714) Additional paid-in capital 134,821 304,992 Total stockholders’ equity attributable to Clear Secure, Inc. 128,970 233,329 Non-controlling interest 52,068 135,895 Total stockholders’ equity 181,038 369,224 Total liabilities and stockholders’ equity $ 858,577 $ 1,045,009
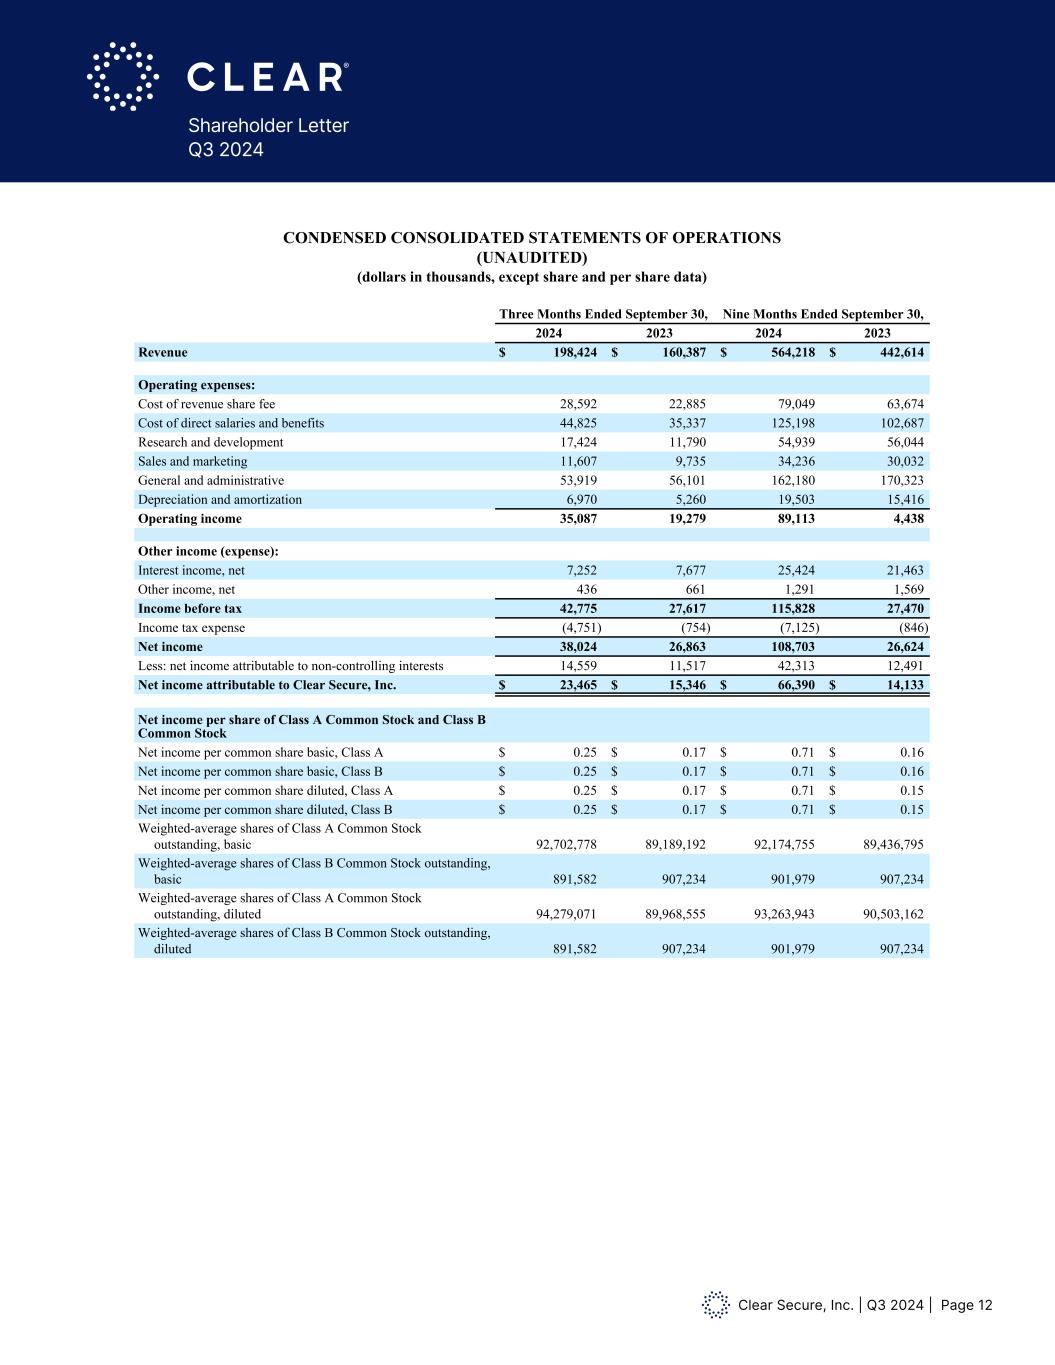
Clear Secure, Inc. | Q3 2024 | Page 12 Shareholder Letter Q3 2024 CLEAR SECURE, INC. CONDENSED CONSOLIDATED STATEMENTS OF OPERATIONS (UNAUDITED) (dollars in thousands, except share and per share data) Three Months Ended September 30, Nine Months Ended September 30, 2024 2023 2024 2023 Revenue $ 198,424 $ 160,387 $ 564,218 $ 442,614 Operating expenses: Cost of revenue share fee 28,592 22,885 79,049 63,674 Cost of direct salaries and benefits 44,825 35,337 125,198 102,687 Research and development 17,424 11,790 54,939 56,044 Sales and marketing 11,607 9,735 34,236 30,032 General and administrative 53,919 56,101 162,180 170,323 Depreciation and amortization 6,970 5,260 19,503 15,416 Operating income 35,087 19,279 89,113 4,438 Other income (expense): Interest income, net 7,252 7,677 25,424 21,463 Other income, net 436 661 1,291 1,569 Income before tax 42,775 27,617 115,828 27,470 Income tax expense (4,751) (754) (7,125) (846) Net income 38,024 26,863 108,703 26,624 Less: net income attributable to non-controlling interests 14,559 11,517 42,313 12,491 Net income attributable to Clear Secure, Inc. $ 23,465 $ 15,346 $ 66,390 $ 14,133 Net income per share of Class A Common Stock and Class B Common Stock Net income per common share basic, Class A $ 0.25 $ 0.17 $ 0.71 $ 0.16 Net income per common share basic, Class B $ 0.25 $ 0.17 $ 0.71 $ 0.16 Net income per common share diluted, Class A $ 0.25 $ 0.17 $ 0.71 $ 0.15 Net income per common share diluted, Class B $ 0.25 $ 0.17 $ 0.71 $ 0.15 Weighted-average shares of Class A Common Stock outstanding, basic 92,702,778 89,189,192 92,174,755 89,436,795 Weighted-average shares of Class B Common Stock outstanding, basic 891,582 907,234 901,979 907,234 Weighted-average shares of Class A Common Stock outstanding, diluted 94,279,071 89,968,555 93,263,943 90,503,162 Weighted-average shares of Class B Common Stock outstanding, diluted 891,582 907,234 901,979 907,234
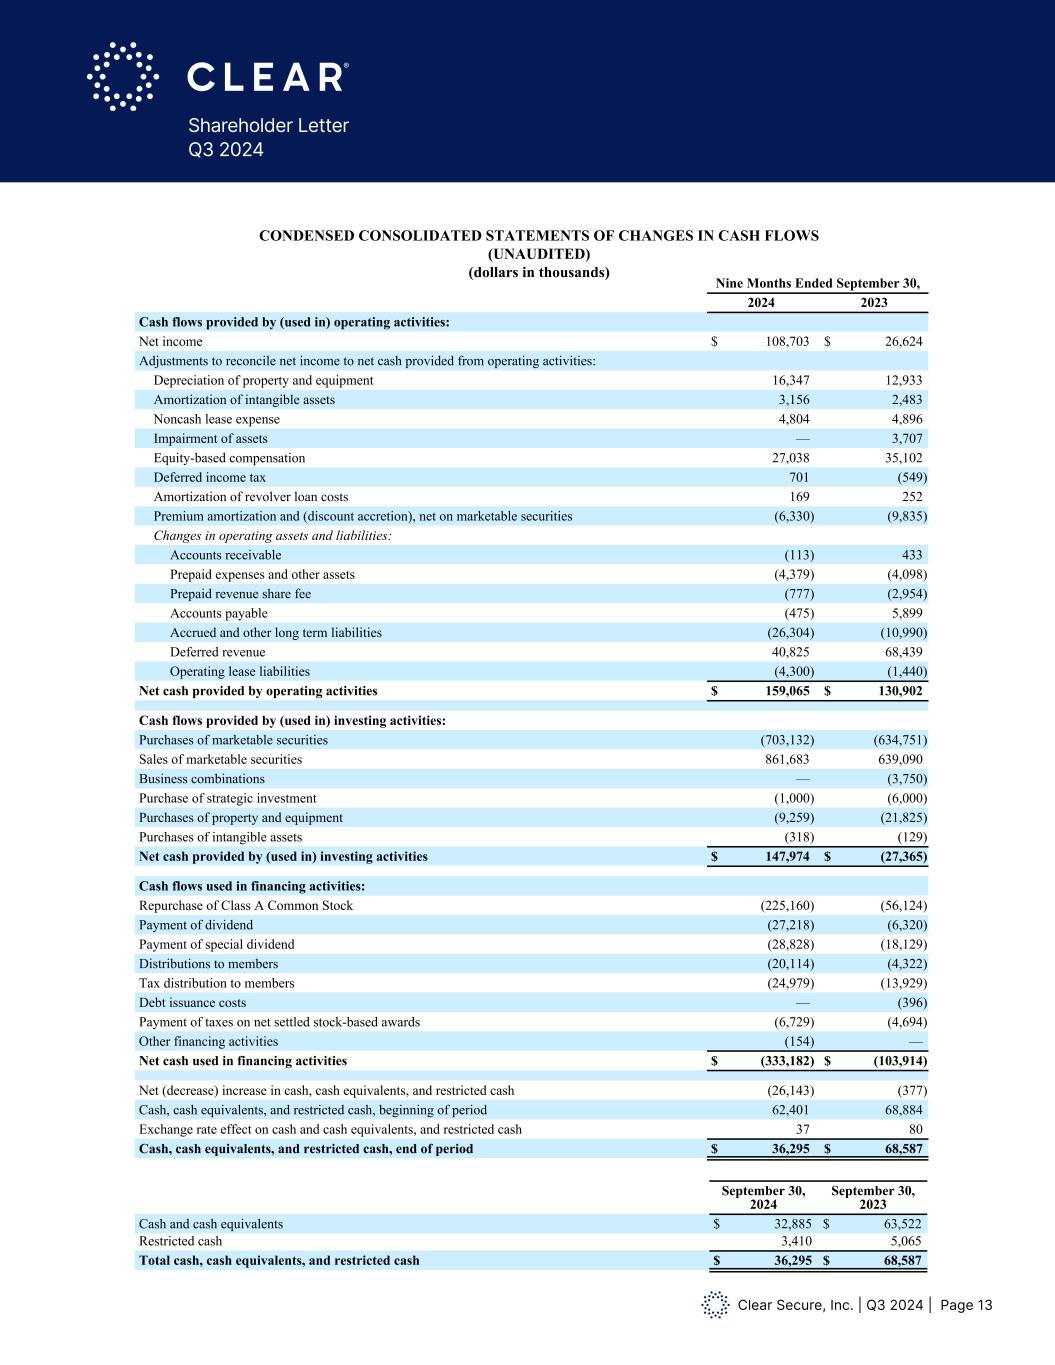
Clear Secure, Inc. | Q3 2024 | Page 13 Shareholder Letter Q3 2024 CLEAR SECURE, INC. CONDENSED CONSOLIDATED STATEMENTS OF CHANGES IN CASH FLOWS (UNAUDITED) (dollars in thousands) Nine Months Ended September 30, 2024 2023 Cash flows provided by (used in) operating activities: Net income $ 108,703 $ 26,624 Adjustments to reconcile net income to net cash provided from operating activities: Depreciation of property and equipment 16,347 12,933 Amortization of intangible assets 3,156 2,483 Noncash lease expense 4,804 4,896 Impairment of assets — 3,707 Equity-based compensation 27,038 35,102 Deferred income tax 701 (549) Amortization of revolver loan costs 169 252 Premium amortization and (discount accretion), net on marketable securities (6,330) (9,835) Changes in operating assets and liabilities: Accounts receivable (113) 433 Prepaid expenses and other assets (4,379) (4,098) Prepaid revenue share fee (777) (2,954) Accounts payable (475) 5,899 Accrued and other long term liabilities (26,304) (10,990) Deferred revenue 40,825 68,439 Operating lease liabilities (4,300) (1,440) Net cash provided by operating activities $ 159,065 $ 130,902 Cash flows provided by (used in) investing activities: Purchases of marketable securities (703,132) (634,751) Sales of marketable securities 861,683 639,090 Business combinations — (3,750) Purchase of strategic investment (1,000) (6,000) Purchases of property and equipment (9,259) (21,825) Purchases of intangible assets (318) (129) Net cash provided by (used in) investing activities $ 147,974 $ (27,365) Cash flows used in financing activities: Repurchase of Class A Common Stock (225,160) (56,124) Payment of dividend (27,218) (6,320) Payment of special dividend (28,828) (18,129) Distributions to members (20,114) (4,322) Tax distribution to members (24,979) (13,929) Debt issuance costs — (396) Payment of taxes on net settled stock-based awards (6,729) (4,694) Other financing activities (154) — Net cash used in financing activities $ (333,182) $ (103,914) Net (decrease) increase in cash, cash equivalents, and restricted cash (26,143) (377) Cash, cash equivalents, and restricted cash, beginning of period 62,401 68,884 Exchange rate effect on cash and cash equivalents, and restricted cash 37 80 Cash, cash equivalents, and restricted cash, end of period $ 36,295 $ 68,587 September 30, 2024 September 30, 2023 Cash and cash equivalents $ 32,885 $ 63,522 Restricted cash 3,410 5,065 Total cash, cash equivalents, and restricted cash $ 36,295 $ 68,587 CLEAR SECURE, INC. CONDENSED CONSOLIDATED STATEMENTS OF CHANGES IN CASH FLOWS (UNAUDITED) (dollars in thousands) Nine Months Ended September 30, 2024 2023 Cash flows provided by (used in) operating activities: Net income $ 108,703 $ 26,624 Adjustments to reconcile net income to net cash provided from operating activities: Depreciation of property and equipment 16,347 12,933 Amortization of intangible assets 3,156 2,483 Noncash lease expense 4,804 4,896 Impairment of assets — 3,707 Equity-based compensation 27,038 35,102 Deferred income tax 701 (549) Amortization of revolver loan costs 169 252 Premium amortization and (discount accretion), net on marketable securities (6,330) (9,835) Changes in operating assets and liabilities: Accounts receivable (113) 433 Prepaid expenses and other assets (4,379) (4,098) Prepaid revenue share fee (777) (2,954) Accounts payable (475) 5,899 Accrued and other long term liabilities (26,304) (10,990) Deferred revenue 40,825 68,439 Operating lease liabilities (4,300) (1,440) Net cash provided by operating activities $ 159,065 $ 130,902 Cash flows provided by (used in) investing activities: Purchases of marketable securities (703,132) (634,751) Sales of marketable securities 861,683 639,090 Business combinations — (3,750) Purchase of strategic investment (1,000) (6,000) Purchases of property and equipment (9,259) (21,825) Purchases of intangible assets (318) (129) Net cash provided by (used in) investing activities $ 147,974 $ (27,365) Cash flows used in financing activities: Repurchase of Class A Common Stock (225,160) (56,124) Payment of dividend (27,218) (6,320) Payment of special dividend (28,828) (18,129) Distributions to members (20,114) (4,322) Tax distribution to members (24,979) (13,929) Debt issuance costs — (396) Payment of taxes on net settled stock-based awards (6,729) (4,694) Other financing activities (154) — Net cash used in financing activities $ (333,182) $ (103,914) Net (decrease) increase in cash, cash equivalents, and restricted cash (26,143) (377) Cash, cash equivalents, and restricted cash, beginning of period 62,401 68,884 Exchange rate effect on cash and cash equivalents, and restricted cash 37 80 Cash, cash equivalents, and restricted cash, end of period $ 36,295 $ 68,587 September 30, 2024 September 30, 2023 Cash and cash equivalents $ 32,885 $ 63,522 Restricted cash 3,410 5,065 Total cash, cash equivalents, and restricted cash $ 36,295 $ 68,587
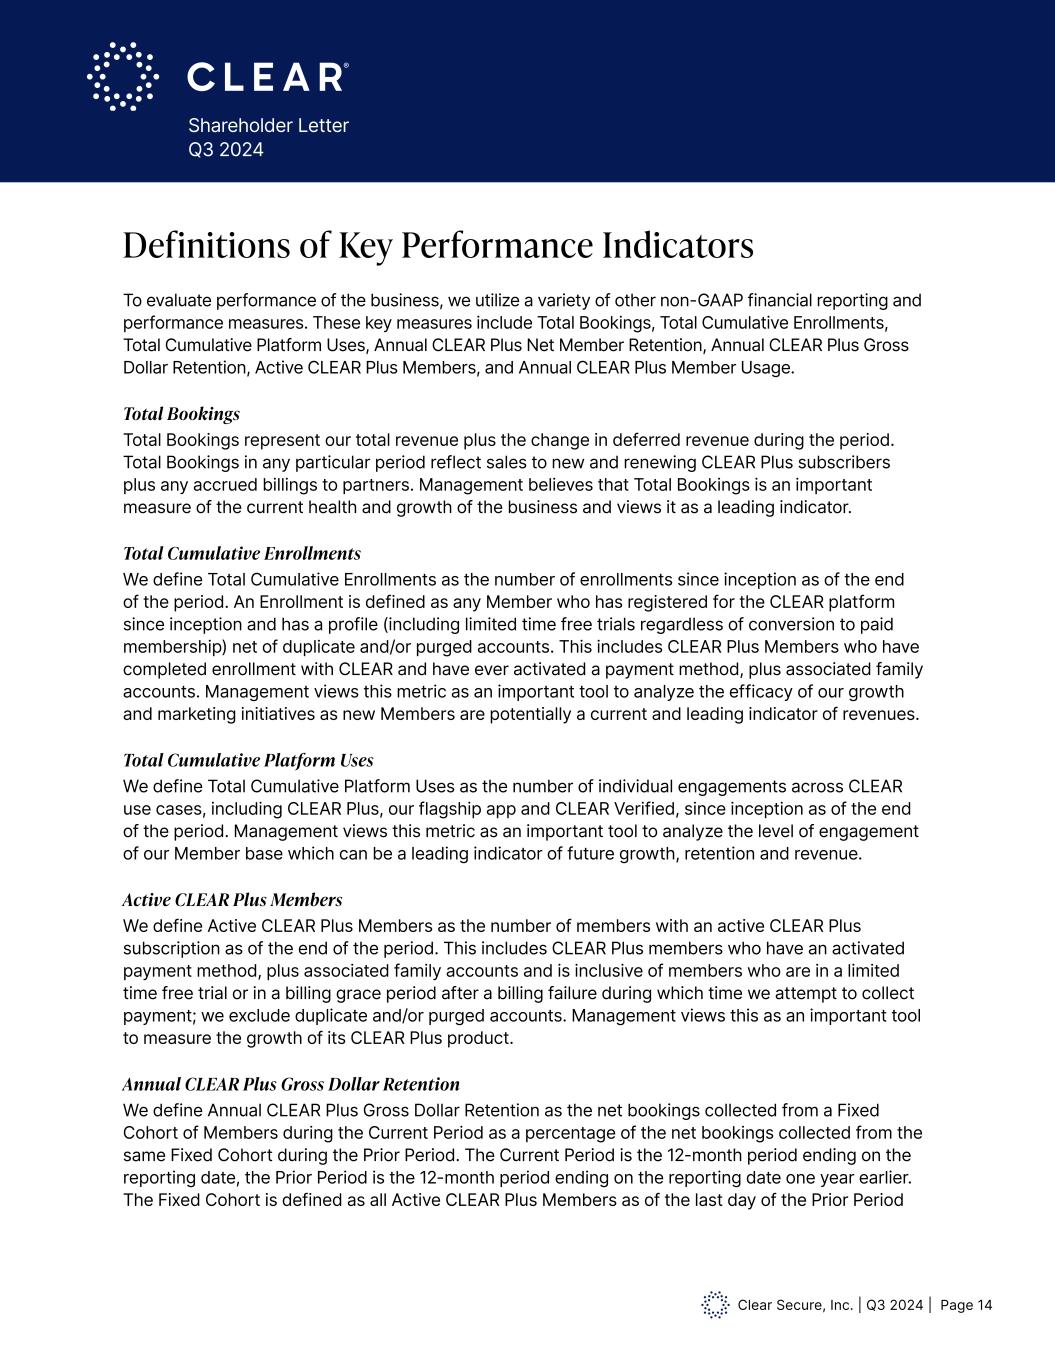
Clear Secure, Inc. | Q3 2024 | Page 14 Shareholder Letter Q3 2024 To evaluate performance of the business, we utilize a variety of other non-GAAP financial reporting and performance measures. These key measures include Total Bookings, Total Cumulative Enrollments, Total Cumulative Platform Uses, Annual CLEAR Plus Net Member Retention, Annual CLEAR Plus Gross Dollar Retention, Active CLEAR Plus Members, and Annual CLEAR Plus Member Usage. Total Bookings Total Bookings represent our total revenue plus the change in deferred revenue during the period. Total Bookings in any particular period reflect sales to new and renewing CLEAR Plus subscribers plus any accrued billings to partners. Management believes that Total Bookings is an important measure of the current health and growth of the business and views it as a leading indicator. Total Cumulative Enrollments We define Total Cumulative Enrollments as the number of enrollments since inception as of the end of the period. An Enrollment is defined as any Member who has registered for the CLEAR platform since inception and has a profile (including limited time free trials regardless of conversion to paid membership) net of duplicate and/or purged accounts. This includes CLEAR Plus Members who have completed enrollment with CLEAR and have ever activated a payment method, plus associated family accounts. Management views this metric as an important tool to analyze the efficacy of our growth and marketing initiatives as new Members are potentially a current and leading indicator of revenues. Total Cumulative Platform Uses We define Total Cumulative Platform Uses as the number of individual engagements across CLEAR use cases, including CLEAR Plus, our flagship app and CLEAR Verified, since inception as of the end of the period. Management views this metric as an important tool to analyze the level of engagement of our Member base which can be a leading indicator of future growth, retention and revenue. Active CLEAR Plus Members We define Active CLEAR Plus Members as the number of members with an active CLEAR Plus subscription as of the end of the period. This includes CLEAR Plus members who have an activated payment method, plus associated family accounts and is inclusive of members who are in a limited time free trial or in a billing grace period after a billing failure during which time we attempt to collect payment; we exclude duplicate and/or purged accounts. Management views this as an important tool to measure the growth of its CLEAR Plus product. Annual CLEAR Plus Gross Dollar Retention We define Annual CLEAR Plus Gross Dollar Retention as the net bookings collected from a Fixed Cohort of Members during the Current Period as a percentage of the net bookings collected from the same Fixed Cohort during the Prior Period. The Current Period is the 12-month period ending on the reporting date, the Prior Period is the 12-month period ending on the reporting date one year earlier. The Fixed Cohort is defined as all Active CLEAR Plus Members as of the last day of the Prior Period Definitions of Key Performance Indicators
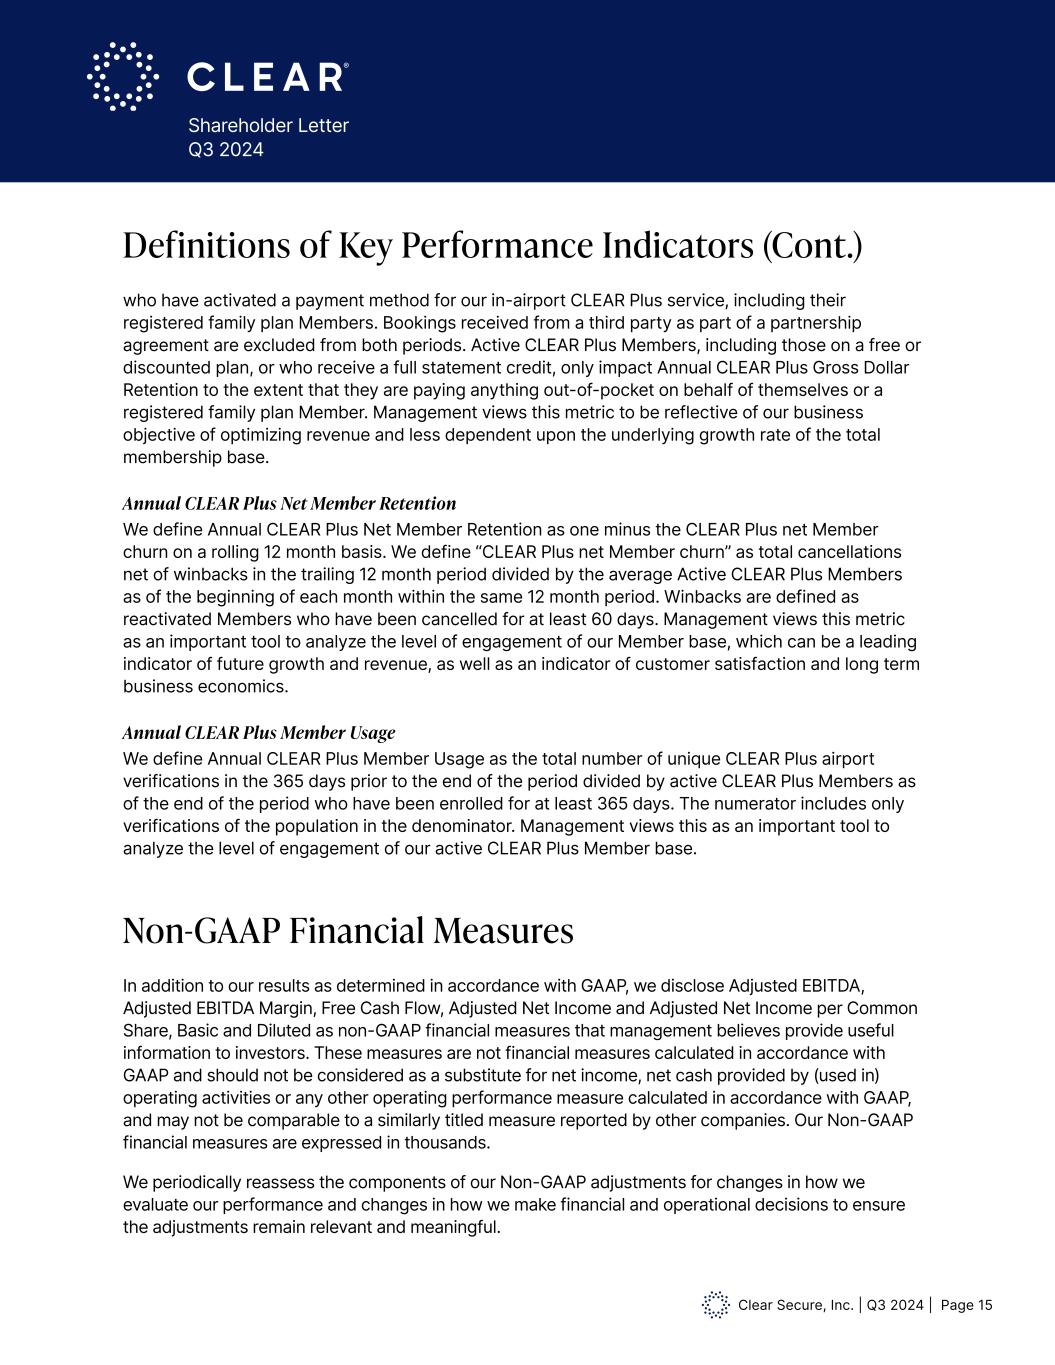
Clear Secure, Inc. | Q3 2024 | Page 15 Shareholder Letter Q3 2024 In addition to our results as determined in accordance with GAAP, we disclose Adjusted EBITDA, Adjusted EBITDA Margin, Free Cash Flow, Adjusted Net Income and Adjusted Net Income per Common Share, Basic and Diluted as non-GAAP financial measures that management believes provide useful information to investors. These measures are not financial measures calculated in accordance with GAAP and should not be considered as a substitute for net income, net cash provided by (used in) operating activities or any other operating performance measure calculated in accordance with GAAP, and may not be comparable to a similarly titled measure reported by other companies. Our Non-GAAP financial measures are expressed in thousands. We periodically reassess the components of our Non-GAAP adjustments for changes in how we evaluate our performance and changes in how we make financial and operational decisions to ensure the adjustments remain relevant and meaningful. Non-GAAP Financial Measures who have activated a payment method for our in-airport CLEAR Plus service, including their registered family plan Members. Bookings received from a third party as part of a partnership agreement are excluded from both periods. Active CLEAR Plus Members, including those on a free or discounted plan, or who receive a full statement credit, only impact Annual CLEAR Plus Gross Dollar Retention to the extent that they are paying anything out-of-pocket on behalf of themselves or a registered family plan Member. Management views this metric to be reflective of our business objective of optimizing revenue and less dependent upon the underlying growth rate of the total membership base. Annual CLEAR Plus Net Member Retention We define Annual CLEAR Plus Net Member Retention as one minus the CLEAR Plus net Member churn on a rolling 12 month basis. We define “CLEAR Plus net Member churn” as total cancellations net of winbacks in the trailing 12 month period divided by the average Active CLEAR Plus Members as of the beginning of each month within the same 12 month period. Winbacks are defined as reactivated Members who have been cancelled for at least 60 days. Management views this metric as an important tool to analyze the level of engagement of our Member base, which can be a leading indicator of future growth and revenue, as well as an indicator of customer satisfaction and long term business economics. Annual CLEAR Plus Member Usage We define Annual CLEAR Plus Member Usage as the total number of unique CLEAR Plus airport verifications in the 365 days prior to the end of the period divided by active CLEAR Plus Members as of the end of the period who have been enrolled for at least 365 days. The numerator includes only verifications of the population in the denominator. Management views this as an important tool to analyze the level of engagement of our active CLEAR Plus Member base. Definitions of Key Performance Indicators (Cont.)
Clear Secure, Inc. | Q3 2024 | Page 16 Shareholder Letter Q3 2024 Adjusted EBITDA and Adjusted EBITDA Margin We define Adjusted EBITDA as net income adjusted for income taxes, interest (income) expense net, depreciation and amortization, impairment and losses on asset disposals, equity-based compensation expense, mark to market of warrant liabilities, net other income (expense) excluding sublease rental income, acquisition-related costs and changes in fair value of contingent consideration. Adjusted EBITDA is an important financial measure used by management and our board of directors (“Board”) to evaluate business performance. We believe Adjusted EBITDA assists investors in evaluating the performance of the Company’s core operations by excluding certain items that impact the comparability of results from period to period. During the third quarter of fiscal year 2022, we revised our definition of Adjusted EBITDA to exclude sublease rental income from our other income (expense) adjustment. During the fourth quarter of fiscal year 2022, we revised our definition of Adjusted EBITDA to include impairment on assets as a separate component. We did not revise prior years' Adjusted EBITDA because there was no impact of a similar nature in the prior period that affects comparability. Adjusted EBITDA margin is adjusted EBITDA, divided by total revenues. Adjusted Net Income We define Adjusted Net Income as net income attributable to Clear Secure, Inc. adjusted for the net income attributable to non-controlling interests, equity-based compensation expense, amortization of acquired intangible assets, acquisition-related costs, changes in fair value of contingent consideration and the income tax effect of these adjustments, using an effective tax rate. We believe these adjustments assist investors in evaluating the performance of the Company’s core operations assuming the exchange of all vested and outstanding common units in Alclear. In addition, this measure, while not necessarily calculated in the same way as similarly titled measures used by other companies, facilitates comparisons with other companies that have different organizational and tax structures. Adjusted Net Income is used in the calculation of Adjusted Net Income per Common Share as defined below. Adjusted Net Income per Common Share We compute Adjusted Net Income per Common Share, Basic as Adjusted Net Income divided by Adjusted Weighted-Average Shares Outstanding for our Class A Common Stock, Class B Common Stock, Class C Common Stock and Class D Common Stock assuming the exchange of all vested and outstanding common units in Alclear at the end of each period presented. We do not present Adjusted Net Income per Common Share for shares of our Class B Common Stock although they are participating securities based on the assumed conversion of those shares to our Class A Common Stock. We do not present Adjusted Net Income per Common Share on a dilutive basis for periods where we have Adjusted Net Income since we do not assume the conversion of any potentially dilutive equity instruments as the result would be anti-dilutive. In periods where we have Adjusted Net Income, the Company also calculates Adjusted Net Income per Common Share, Diluted based on the effect of potentially dilutive equity instruments for the periods presented using the treasury stock/if-converted method, as applicable. Non-GAAP Financial Measures (Cont.)
Clear Secure, Inc. | Q3 2024 | Page 17 Shareholder Letter Q3 2024 Adjusted Net Income and Adjusted Net Income per Common Share exclude, to the extent applicable, the tax effected impact of non-cash expenses and other items that are not directly related to our core operations. These items are excluded because they are connected to the Company’s long term growth plan and not intended to increase short term revenue in a specific period. We believe these adjustments assist investors in evaluating the performance of the Company’s core operations assuming the exchange of all vested and outstanding common units in Alclear. Further, to the extent that other companies use similar methods in calculating non-GAAP measures, the provision of supplemental non-GAAP information can allow for a comparison of the Company’s relative performance against other companies that also report non-GAAP operating results. Free Cash Flow We define Free Cash Flow as net cash provided by operating activities adjusted for purchases of property and equipment. We believe Free Cash Flow provides useful information to management and investors about the Company’s liquidity and cash flow trends. With regards to our CLEAR Plus subscription service, we generally collect cash from our members upfront for annual subscriptions. As a result, when the business is growing Free Cash Flow can be a real time indicator of the current trajectory of the business. See below for reconciliations of these non-GAAP financial measures to their most comparable GAAP measures. Forward-Looking Statements This release may contain statements that constitute forward-looking statements within the meaning of the Private Securities Litigation Reform Act of 1995. Investors are cautioned that any and such forward looking statement are not guarantees of future performance or results and involve risks and uncertainties, and that actual results, developments and events may differ materially from those in the forward-looking statements as a result of various factors, including those described in the Company’s filings with the Securities and Exchange Commission, including the sections titled “Risk Factors” in our Annual Report on Form 10-K for the year ended December 31, 2023. The Company disclaims any obligation to update any forward looking statements contained herein.
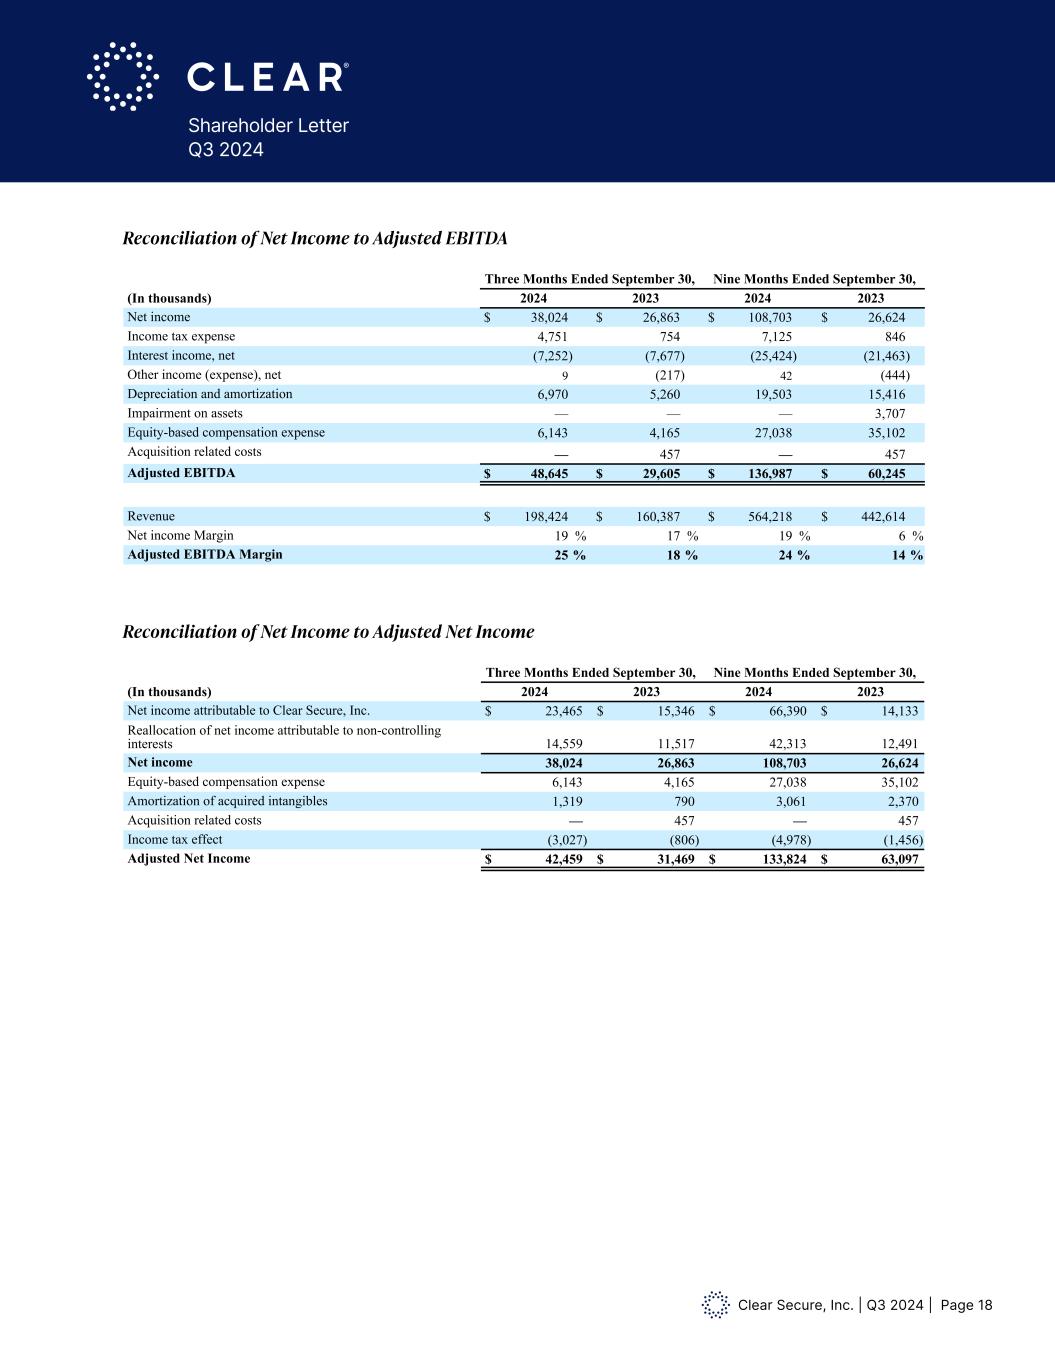
Clear Secure, Inc. | Q3 2024 | Page 18 Shareholder Letter Q3 2024 Free Cash Flow We define Free Cash Flow as net cash provided by operating activities adjusted for purchases of property and equipment. We believe Free Cash Flow provides useful information to management and investors about the Company’s liquidity and cash flow trends. With regards to our CLEAR Plus subscription service, we generally collect cash from our members upfront for annual subscriptions. As a result, when the business is growing Free Cash Flow can be a real time indicator of the current trajectory of the business. See below for reconciliations of these non-GAAP financial measures to their most comparable GAAP measures. Forward Looking Statements This release may contain statements that constitute forward-looking statements within the meaning of the Private Securities Litigation Reform Act of 1995. Investors are cautioned that any and such forward looking statement are not guarantees of future performance or results and involve risks and uncertainties, and that actual results, developments and events may differ materially from those in the forward-looking statements as a result of various factors, including those described in the Company’s filings with the Securities and Exchange Commission, including the sections titled “Risk Factors” in our Annual Report on Form 10-K for the year ended December 31, 2023. The Company disclaims any obligation to update any forward looking statements contained herein. Reconciliation of Net Income to Adjusted EBITDA Three Months Ended September 30, Nine Months Ended September 30, (In thousands) 2024 2023 2024 2023 Net income $ 38,024 $ 26,863 $ 108,703 $ 26,624 Income tax expense 4,751 754 7,125 846 Interest income, net (7,252) (7,677) (25,424) (21,463) Other income (expense), net 9 (217) 42 (444) Depreciation and amortization 6,970 5,260 19,503 15,416 Impairment on assets — — — 3,707 Equity-based compensation expense 6,143 4,165 27,038 35,102 Acquisition related costs — 457 — 457 Adjusted EBITDA $ 48,645 $ 29,605 $ 136,987 $ 60,245 Revenue $ 198,424 $ 160,387 $ 564,218 $ 442,614 Net income Margin 19 % 17 % 19 % 6 % Adjusted EBITDA Margin 25 % 18 % 24 % 14 % Reconciliation of Net Income to Adjusted Net Income Three Months Ended September 30, Nine Months Ended September 30, (In thousands) 2024 2023 2024 2023 Net income attributable to Clear Secure, Inc. $ 23,465 $ 15,346 $ 66,390 $ 14,133 Reallocation of net income attributable to non-controlling interests 14,559 11,517 42,313 12,491 Net income 38,024 26,863 108,703 26,624 Equity-based compensation expense 6,143 4,165 27,038 35,102 Amortization of acquired intangibles 1,319 790 3,061 2,370 Acquisition related costs — 457 — 457 Income tax effect (3,027) (806) (4,978) (1,456) Adjusted Net Income $ 42,459 $ 31,469 $ 133,824 $ 63,097 Free Cash Flow We define Free Cash Flow as net cash provided by operating activities adjusted for purchases of property and equipment. We believe Free Cash Flow provides useful information to management and investors about the Company’s liquidity and cash flow trends. With regards to our CLEAR Plus subscription service, we generally collect cash from our members upfront for annual subscriptions. As a result, when the business is growing Free Cash Flow can be a real time indicator of the current trajectory of the business. See below for reconciliations of these non-GAAP financial measures to their most comparable GAAP measures. Forward Looking Statements This release may contain statements that constitute forward-looking statements within the meaning of the Private Securities Litigation Reform Act of 1995. Investors are cautioned that any and such forward looking statement are not guarantees of future performance or results and involve risks and uncertainties, and that actual results, developments and events may differ materially from those in the forward-looking state ents as a result of various factors, including those described in the Company’s filings with the Securities and Exchange Commission, including the sections titled “Risk Factors” in our Annual Report on Form 10-K for the year ended Decemb r 31, 2023. The Company disclaims any obligation to update any forward looking statements contained herein. Reconciliation of Net Income to Adjusted EBITDA Three Months Ended September 30, Nine Months Ended September 30, (In thousands) 2024 2023 2024 2023 Net income $ 38 024 $ 26 863 $ 108 703 $ 6 624 Income tax exp ns 4,751 754 7,125 8 6 Inte st income, net (7 252) (7 677) (25 424) (21 63) Other income (exp nse), net 9 (217) 42 (444) Depreciation and amortization 970 5 2 0 19 503 1 416 Impairment on assets — 3,70 Equity-based compensation expense 6,1 3 4,16 27,038 35,102 Acquisition related costs — 457 — 457 Adjusted EBITDA $ 48,645 $ 29,605 $ 136,987 $ 60,245 Revenue $ 198,4 4 $ 160,387 $ 564,218 $ 442,6 Net income Margin 19 % 17 % 19 % 6 % Adjusted EBITDA Margin 25 % 18 % 24 % 14 % Reconcili tion of Net Income to Adjusted Net Income Three Months Ended September 30, Nine Months Ended September 30, (In thousands) 2024 2023 2024 2023 Net income attributable to Clear Secure, Inc. $ 23,465 $ 15,346 $ 66,390 $ 14,133 Reallocation of net income attributable to non-controlling interests 14 559 11 517 42 313 12 491 Net income 38 024 26,863 108 703 26 624 Equity-based compensation expense 6,143 4,165 27,038 35,102 Amortization of acquired intangibles 1 319 790 3 061 2 370 cq isition related costs — 57 — 45 Income tax effect (3,027) (806) (4,978) (1,456) Adjusted Net Income $ 42,459 $ 31,469 $ 133,824 $ 63,097 Reconciliation of Net Income to Adjusted EBITDA Reconciliation of Net Income to Adjusted Net Income
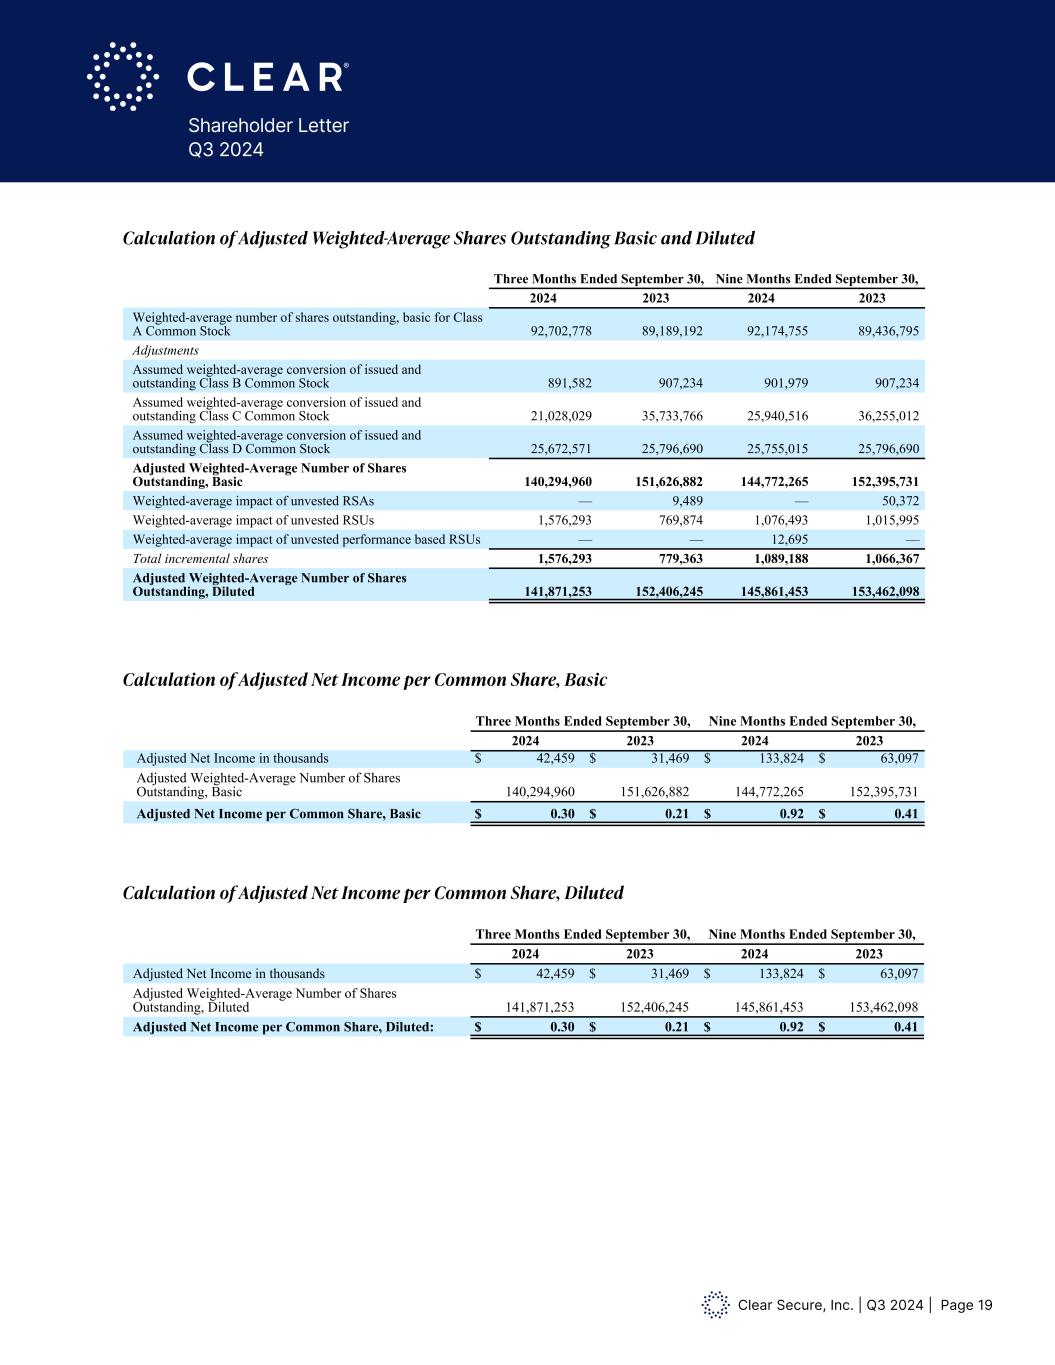
Clear Secure, Inc. | Q3 2024 | Page 19 Shareholder Letter Q3 2024 Calculation of Adjusted Weighted-Average Shares Outstanding Basic and Diluted Calculation of Adjusted Net Income per Common Share, Basic Calculation of Adjusted Net Income per Common Share, Diluted Calculation of Adjusted Weighted-Average Shares Outstanding Basic and Diluted Three Months Ended September 30, Nine Months Ended September 30, 2024 2023 2024 2023 Weighted-average number of shares outstanding, basic for Class A Common Stock 92,702,778 89,189,192 92,174,755 89,436,795 Adjustments Assumed weighted-average conversion of issued and outstanding Class B Common Stock 891,582 907,234 901,979 907,234 Assumed weighted-average conversion of issued and outstanding Class C Common Stock 21,028,029 35,733,766 25,940,516 36,255,012 Assumed weighted-average conversion of issued and outstanding Class D Common Stock 25,672,571 25,796,690 25,755,015 25,796,690 Adjusted Weighted-Average Number of Shares Outstanding, Basic 140,294,960 151,626,882 144,772,265 152,395,731 Weighted-average impact of unvested RSAs — 9,489 — 50,372 Weighted-average impact of unvested RSUs 1,576,293 769,874 1,076,493 1,015,995 Weighted-average impact of unvested performance based RSUs — — 12,695 — Total incremental shares 1,576,293 779,363 1,089,188 1,066,367 Adjusted Weighted-Average Number of Shares Outstanding, Diluted 141,871,253 152,406,245 145,861,453 153,462,098 Calculation of Adjusted Net Income per Common Share, Basic Three Months Ended September 30, Nine Months Ended September 30, 2024 2023 2024 2023 Adjusted Net Income in thousands $ 42,459 $ 31,469 $ 133,824 $ 63,097 Adjusted Weighted-Average Number of Shares Outstanding, Basic 140,294,960 151,626,882 144,772,265 152,395,731 Adjusted Net Income per Common Share, Basic $ 0.30 $ 0.21 $ 0.92 $ 0.41 Calculation of Adjusted Net Income per Common Share, Diluted Three Months Ended September 30, Nine Months Ended September 30, 2024 2023 2024 2023 Adjusted Net Income in thousands $ 42,459 $ 31,469 $ 133,824 $ 63,097 Adjusted Weighted-Average Number of Shares Outstanding, Diluted 141,871,253 152,406,245 145,861,453 153,462,098 Adjusted Net Income per Common Share, Diluted: $ 0.30 $ 0.21 $ 0.92 $ 0.41 Summary of Adjusted Net Income per Common Share Three Months Ended September 30, Nine Months Ended September 30, 2024 2023 2024 2023 Adjusted Net Income per Common Share, Basic $ 0.30 $ 0.21 $ 0.92 $ 0.41 Adjusted Net Income per Common Share, Diluted $ 0.30 $ 0.21 $ 0.92 $ 0.41 Reconciliation of Net Cash Provided by Operating Activities to Free Cash Flow Three Months Ended September 30, Nine Months Ended September 30, (In thousands) 2024 2023 2024 2023 Net cash provided by operating activities $ (35,868) $ (4,859) $ 159,065 $ 130,902 Purchases of property and equipment (2,043) (4,035) (9,259) (21,825) Free Cash Flow $ (37,911) $ (8,894) $ 149,806 $ 109,077 Calculation of Adjusted Weighted-Average Shares Outstanding Basic and Diluted Three Months Ended September 30, Nine Months Ended September 30, 024 2023 2024 2023 Weighted-average number of shares outstanding, basic for Class A Common Stock 92,702,778 89,189,192 92,174,755 89,436,795 Adjustme ts i ted-average conversion of i sued and tst i lass B o on Stock 891,582 90 ,234 90 ,979 9 7,234 ss e ei ted-average conversion of issued and outstanding lass C o on Stock 21,028,029 35,733,766 25,940,516 36,255,012 ssumed weighted-average conversion of issued and outstanding Class D Common Stock 25,672,571 25,796,690 25,755,015 25,796,690 Adjusted Weighted-Average Number of Shares Outstan ing, Basic 140,294,960 151,626,882 44,772,265 152,3 5,731 ra e i pact of unvested RSAs — 9,489 — 50,372 Weighted-average impact of unvested RSUs 1,576,293 769,874 1,076,493 1,015,995 Weight -average impact of unvested performance based RSUs — — 12,695 — Total incremental shares 1,576,293 779,363 1,089,188 1,066,367 Adjusted Weighted-Average Number of Shares Outstanding, Diluted 141,871,253 152,406,245 145,861,453 153,462,098 Calculation of Adjusted Net Income per Common Share, Basic Three Months Ended September 30, Nine Months Ended September 30, 2024 2023 2024 2023 Adjusted Net Income in thousands $ 42,459 $ 31,469 $ 133,824 $ 63,097 Adjusted Weighted-Average Number of Shares Outstanding, Basic 140,294,960 151,626,882 144,772,265 152,395,731 Adjus ed Net Incom per Common Share, Basic $ 0.30 $ 0.21 $ 0.92 $ 0.41 Calculation of Adjusted Net Income per Common Share, Diluted Three Months Ended September 30, Nine Months Ended September 30, 2024 2023 2024 2023 Adjusted Net Income in thousands $ 42,459 $ 31,469 $ 133,824 $ 63,097 Adjusted Weighted-Average Number of Shares Outstanding, Diluted 141,871,253 152,406,245 145,861,453 153,462,098 Adjusted Net Income per Com on Share, Diluted: $ 0.30 $ 0.21 $ 0.92 $ 0.41 Summary of Adjusted Net Income per Common Share Three Months Ended September 30, Nine Months Ended September 30, 2024 2023 2024 2023 Adjusted Net Income per Common Share, Basic $ 0.30 $ 0.21 $ 0.92 $ 0.41 Adjusted Net Income per Common Share, Diluted $ 0.30 $ 0.21 $ 0.92 $ 0.41 Reconciliation of Net Cash Provided by Operating Activities to Free Cash Flow Three Months Ended September 30, Nine Months Ended September 30, (In thousands) 2024 2023 2024 2023 Net cash provided by operating activities $ (35,868) $ (4,859) $ 159,065 $ 130,902 Purchases of property and equipment (2,043) (4,035) (9,259) (21,825) Free Cash Flow $ (37,911) $ (8,894) $ 149,806 $ 109,077 Calculation of Adjusted Weighted-Average Shares Outstanding Basic and Diluted Three Months Ended September 30, Nine Months Ended September 30, 2024 2023 2024 2023 Weighted-average number of shares outstanding, basic for Class A Common Stock 92,702,778 89,189,192 92,174,755 89,436,795 Adjustme ts i ted-average conversion of i sued and i lass B on Stock 891,582 907,234 901,979 907,234 ss eighted-average conversion f issued and outstanding Class C Co on Stock 21,028,029 35,733,766 25,940, 16 6,255,012 ssum weight d-average conversion of issued and outstanding Class D Common Stock 25,672,571 25,796,690 25,755,015 25,796,690 Adjusted Weighted-Average Number of Shares Outstanding, Basic 140,294,960 151,626,882 144,772,265 152,395,731 Weighted-average impact of unvested RSAs — 9,489 — 50,372 Weighted-average impact of unvested RSUs 1,576,293 769,874 1,076,493 1,015,995 Weighted-average impact of unvested performance based RSUs — — 12,695 — Total incremental shares 1,576,293 779,363 1,089,188 1,066,367 Adjusted Weighted-Average Number of Shares Outstanding, Diluted 141,871,253 152,406,245 145,861,453 153,462,098 Calculation of Adjusted Net Income per Common Share, Basic Three Months Ended September 30, Nine Months Ended September 30, 2024 2023 2024 2023 Adjusted Net Income in thousands $ 42,459 $ 31,469 $ 133,824 $ 63,097 Adjusted Weighted-Average Number of Shares Outstanding, Basic 140,294,960 151,626,882 144,772,265 152,395,731 Adjusted Net Income per Common Share, Basic $ 0.30 $ 0.21 $ 0.92 $ 0.41 Calculation of Adjusted Net Income per Common Share, Diluted Three Months Ended September 30, Nine Months Ended September 30, 2024 2023 2024 2023 Adjusted Net Income in thousands $ 42,459 $ 31,469 $ 133,824 $ 63,097 Adjusted Weighted-Average Nu ber of Shares Outstanding, Diluted 141,871,253 152,406,245 145,861,453 153,462,098 Adjusted Net Income per Common Share, Diluted: $ 0.30 $ 0.21 $ 0.92 $ 0.41 Summary of Adjusted Net Income per Common Share Three Months Ended September 30, Nine Months Ended September 30, 2024 2023 2024 2023 Adjusted Net Income per Common Share, Basic $ 0.30 $ 0.21 $ 0.92 $ 0.41 Adjusted Net Income per Common Share, Diluted $ 0.30 $ 0.21 $ 0.92 $ 0.41 Reconciliation of Net C sh Pro d d by Operating Activities to Free Cash Flow Three Months Ended September 30, Nine Months Ended September 30, (In thousands) 2024 2023 2024 2023 Net cash provided by operating activities $ (35,868) $ (4,859) $ 159,065 $ 130,9 Purchases of property and equipment (2,043) (4,035) (9,259) (21,825) Free Cash Flow $ (37,911) $ (8,894) $ 149,806 $ 109,077
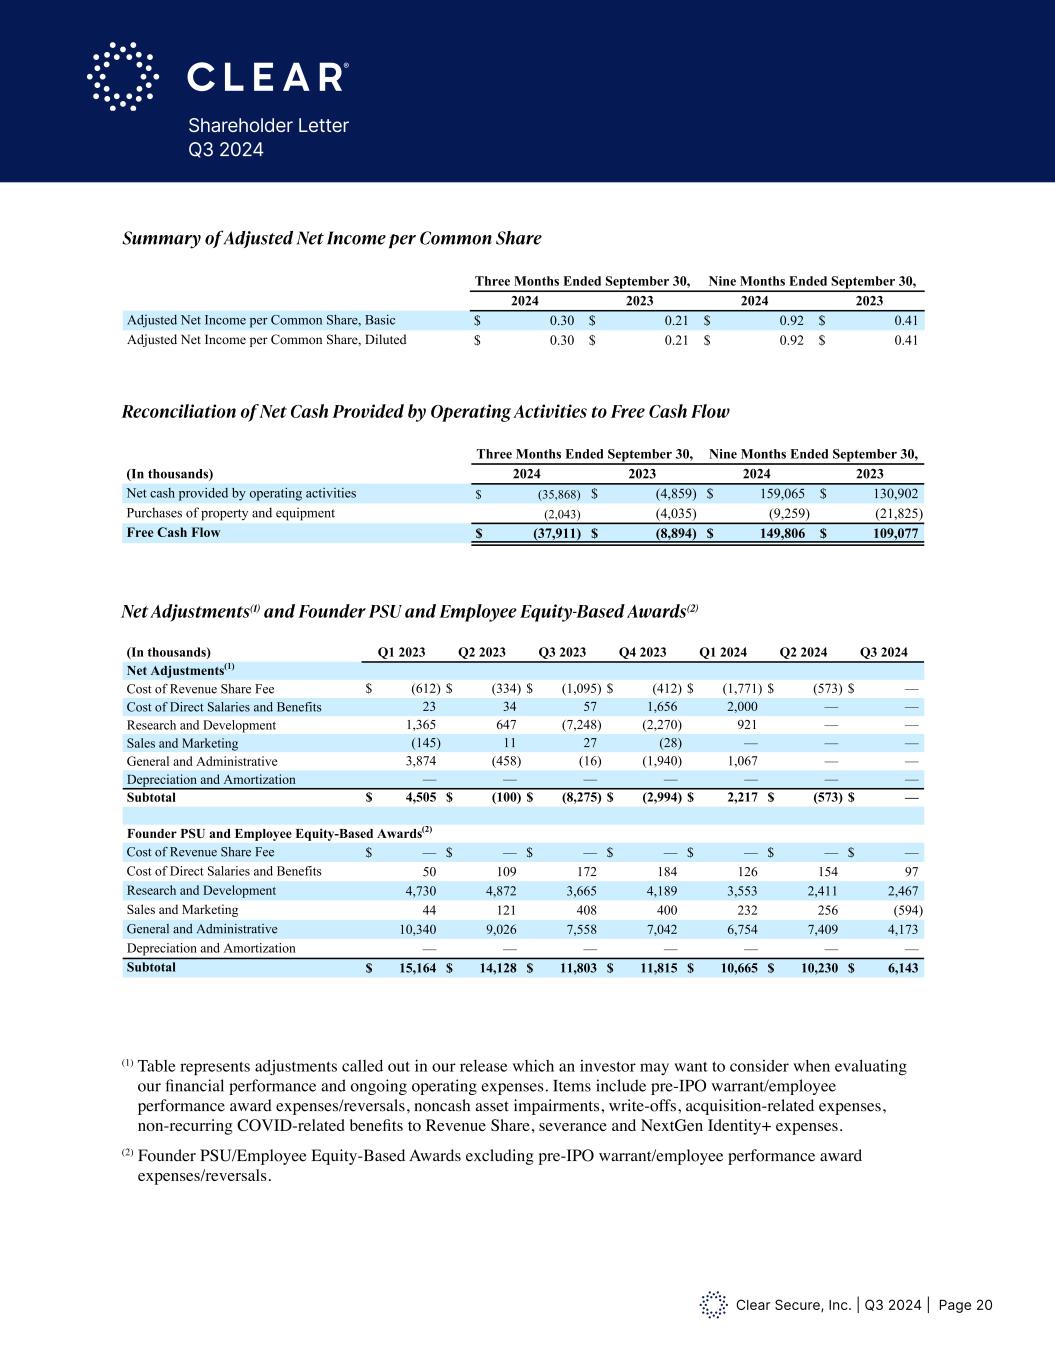
Clear Secure, Inc. | Q3 2024 | Page 20 Shareholder Letter Q3 2024 Summary of Adjusted Net Income per Common Share Reconciliation of Net Cash Provided by Operating Activities to Free Cash Flow Net Adjustments(1) and Founder PSU and Employee Equity-Based Awards(2) (1) Table represents adjustments called out in our release which an investor may want to consider when evaluating our financial performance and ongoing operating expenses. Items include pre-IPO warrant/employee performance award expenses/reversals, noncash asset impairments, write-offs, acquisition-related expenses, non-recurring COVID-related benefits to Revenue Share, severance and NextGen Identity+ expenses. (2) Founder PSU/Employee Equity-Based Awards excluding pre-IPO warrant/employee performance award expenses/reversals. Calculation of Adjusted Weighted-Average Shares Outstanding Basic and Diluted Three Months Ended September 30, Nine Months Ended September 30, 2024 2023 2024 2023 Weighted-average number of shares outstanding, basic for Class A Common Stock 92,702,778 89,189,192 92,174,755 89,436,795 Adjustments Assumed weighted-average conversion of issued and outstanding Class B Common Stock 891,582 907,234 901,979 907,234 Assumed weighted-average conversion of issued and outstanding Class C Common Stock 21,028,029 35,733,766 25,940,516 36,255,012 Assumed weighted-average conversion of issued and outstanding Class D Common Stock 25,672,571 25,796,690 25,755,015 25,796,690 Adjusted Weighted-Average Number of Shares Outstanding, Basic 140,294,960 151,626,882 144,772,265 152,395,731 Weighted-average impact of unvested RSAs — 9,489 — 50,372 Weighted-average impact of unvested RSUs 1,576,293 769,874 1,076,493 1,015,995 Weighted-average impact of unvested performance based RSUs — — 12,695 — Total incremental shares 1,576,293 779,363 1,089,188 1,066,367 Adjusted Weighted-Average Number of Shares Outstanding, Diluted 141,871,253 152,406,245 145,861,453 153,462,098 Calculation of Adjusted Net Income per Common Share, Basic Three Months Ended September 30, Nine Months Ended September 30, 2024 2023 2024 2023 Adjusted Net Income in thousands $ 42,459 $ 31,469 $ 133,824 $ 63,097 Adjusted Weighted-Average Number of Shares Outstanding, Basic 140,294,960 151,626,882 144,772,265 152,395,731 Adjusted Net Income per Common Share, Basic $ 0.30 $ 0.21 $ 0.92 $ 0.41 Calculation of Adjusted Net Income per Common Share, Diluted Three Months Ended September 30, Nine Months Ended September 30, 2024 2023 2024 2023 Adjusted Net Income in thousands $ 42,459 $ 31,469 $ 133,824 $ 63,097 Adjusted Weighted-Average Number of Shares Outstanding, Diluted 141,871,253 152,406,245 145,861,453 153,462,098 Adjusted Net Income per Common Share, Diluted: $ 0.30 $ 0.21 $ 0.92 $ 0.41 Su mary of Adjusted Net Income per Common Share Three Months Ended September 30, Nine Months Ended September 30, 2024 2023 2024 2023 Adjusted Net Income per Common Share, Basic $ 0.30 $ 0.21 $ 0.92 $ 0.41 Adjusted Net Income per Common Share, Diluted $ 0.30 $ 0.21 $ 0.92 $ 0.41 Reconciliation of Net Cash Provided by Operating Activities to Free Cash Flow Three Months Ended September 30, Nine Months Ended September 30, (In thousands) 2024 2023 2024 2023 Net cash provided by operating activities $ (35,868) $ (4,859) $ 159,065 $ 130,902 Purchases of property and equipment (2,043) (4,035) (9,259) (21,825) Free Cash Flow $ (37,911) $ (8,894) $ 149,806 $ 109,077 Calculation of Adjusted Weighted-Average Shares Outstanding Basic and Diluted Three Months Ended September 30, Nine Months Ended September 30, 2024 2023 2024 2023 Weighted-average number of shares outstanding, basic for Class Common Stock 92,702,778 89,189,192 92,174,755 89,436,795 dj stments Assumed weighted-average conversion of issued and outstanding Class B Common Stock 891,582 907,234 901,979 907,234 Assumed weighted-average conversion of issued and outstanding Class C Common Stock 21,028,029 35,733,766 25,940,516 36,255,012 Assumed weighted-average conversion of issued and outstanding Class D Common Stock 25,672,571 25,796,690 25,755,015 25,796,690 Adjusted Weighted-Average Number of Shares Outstan ing, Basic 140,294,960 151,626,882 144,772,265 152,395,731 A — 9,489 — 50,372 RSUs 1,576,293 769,874 1,076,493 1,015,995 Weighted-av rage impact of unvested performance based RSUs — — 12,695 — Total increm ntal shares 1,576,293 779,363 1,089,188 1,066,367 Adjusted Weighted-Average Number of Shares Outstanding, Diluted 141,871,253 152,406,245 145,861,453 153,462,098 Calculation of Adjusted Net Income per Common Share, Basic Three Months Ended September 30, Nine Months Ended September 30, 2024 2023 2024 2023 Net Income in thousands $ 42,459 $ 31,469 $ 133,824 $ 63,097 Adjusted Weighted-Average Number of Shares Outstanding, Basic 140,294,96 151,626,882 144,772,265 152,395,731 Adjusted Net Income per Common Share, Basic $ 0.30 $ 0.21 $ 0.92 $ 0.41 Calculation of Adjusted Net Income per Common Share, Diluted Three Months Ended September 30, Nine Months Ended September 30, 202 202 2024 2023 j t Net Income in thousands $ 42,459 $ 31,469 $ 133,824 $ 63,097 Adjusted Weighted-Average Number of Shares Outstanding, Diluted 141,871,253 152,406,245 145,861,453 153,462,098 Adjusted Net Income per Common Share, Diluted: $ 0.30 $ 0.21 $ 0.92 $ 0.41 Summary of Adjusted Net Income per Common Share Three Months Ended September 30, Nine Months Ended September 30, 2024 2023 2024 2023 djusted et Inco e per o on Share, Basic $ 0.30 $ 0.21 $ 0.92 $ 0.41 Adjusted Net Income per Common Share, Diluted $ 0.30 $ 0.21 $ 0.92 $ 0.41 Reconciliation of Net Cash Provided by Operating Activities to Free Cash Flow Three Months Ended September 30, Nine Months Ended September 30, (In thousands) 2024 2023 2024 2023 Net cash provided by operating activities $ (35,868) $ (4,859) $ 159,065 $ 130,902 Purchases of property and equipment (2,043) (4,035) (9,259) (21,825) Free Cash Flow $ (37,911) $ (8,894) $ 149,806 $ 109,077 Net Adjustments(1) and Founder PSU and Employee Equity-Based Awards(2) (In thousands) Q1 2023 Q2 2023 Q3 2023 Q4 2023 Q1 2024 Q2 2024 Q3 2024 Net Adjustments(1) Cost of Revenue Share Fee $ (612) $ (334) $ (1,095) $ (412) $ (1,771) $ (573) $ — Cost of Direct Salaries and Benefits 23 34 57 1,656 2,000 — — Research and Development 1,365 647 (7,248) (2,270) 921 — — Sales and Marketing (145) 11 27 (28) — — — General and Administrative 3,874 (458) (16) (1,940) 1,067 — — Depreciation and Amortization — — — — — — — Subtotal $ 4,505 $ (100) $ (8,275) $ (2,994) $ 2,217 $ (573) $ — Founder PSU and Employee Equity-Based Awards(2) Cost of Revenue Share Fee $ — $ — $ — $ — $ — $ — $ — Cost of Direct Salaries and Benefits 50 109 172 184 126 154 97 Research and Development 4,730 4,872 3,665 4,189 3,553 2,411 2,467 Sales and Marketing 44 121 408 400 232 256 (594) General and Administrative 10,340 9,026 7,558 7,042 6,754 7,409 4,173 Depreciation and Amortization — — — — — — — Subtotal $ 15,164 $ 14,128 $ 11,803 $ 11,815 $ 10,665 $ 10,230 $ 6,143 (1) Table represents adjustments called out in our release which an investor may want to consider when evaluating our financial performance and ongoing operating expenses. Items include pre-IPO warrant/employee performance award expenses/reversals, non- cash asset impairments, write-offs, acquisition-related expenses, non-recurring COVID-related benefits to Revenue Share, severance and NextGen Identity+ expenses. (2) Founder PSU/Employee Equity-Based Awards excluding pre-IPO warrant/employee performance award expenses/reversals.
