
Shareholder Letter Q2 2023
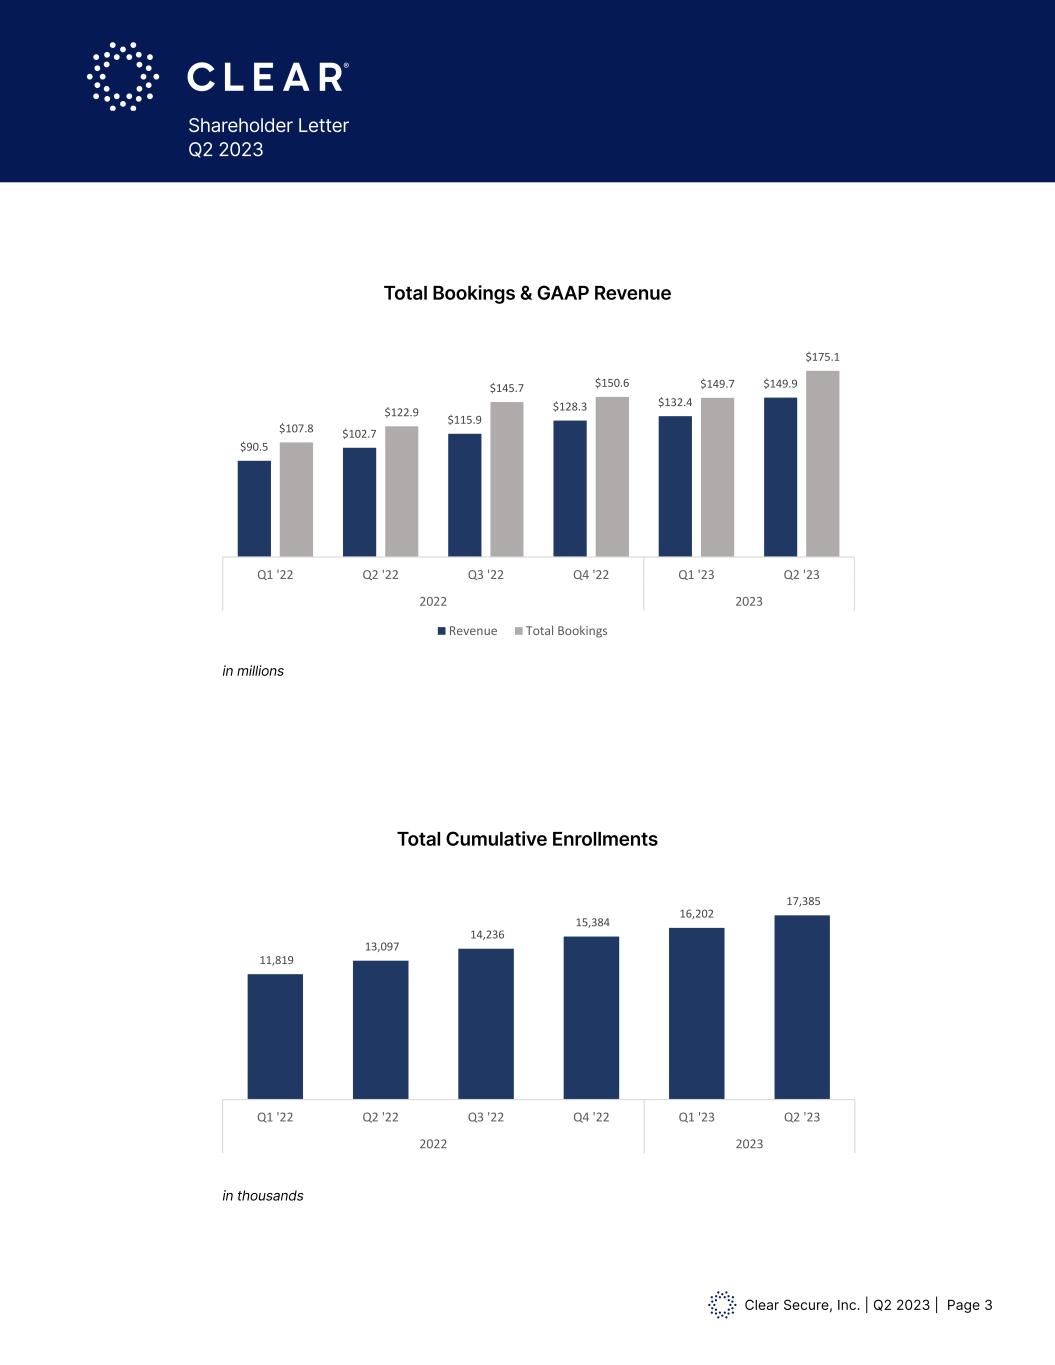
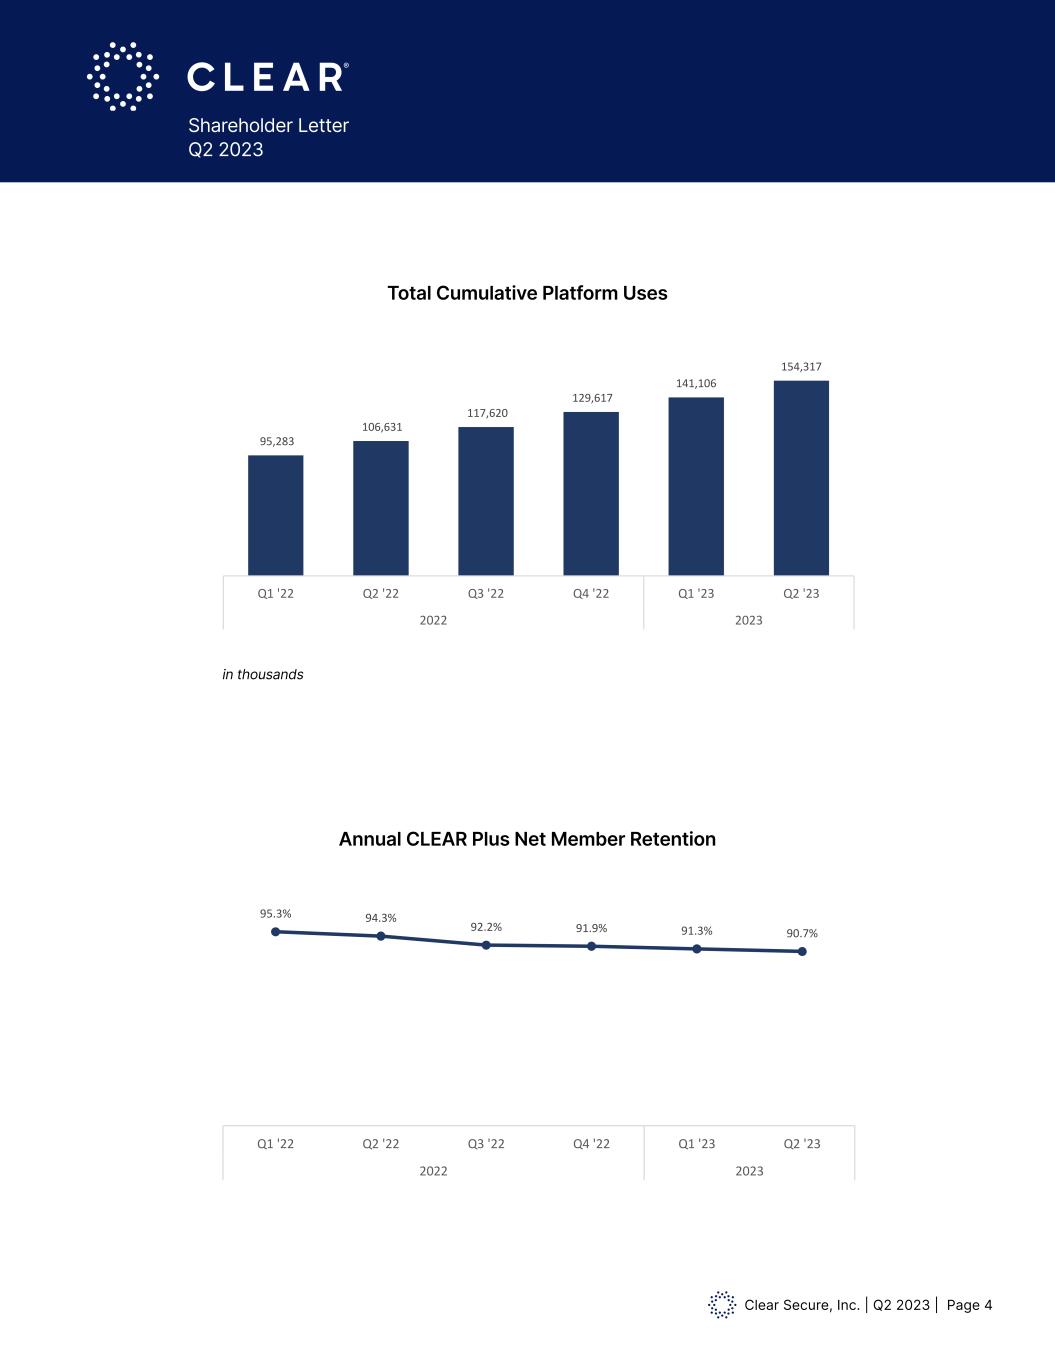
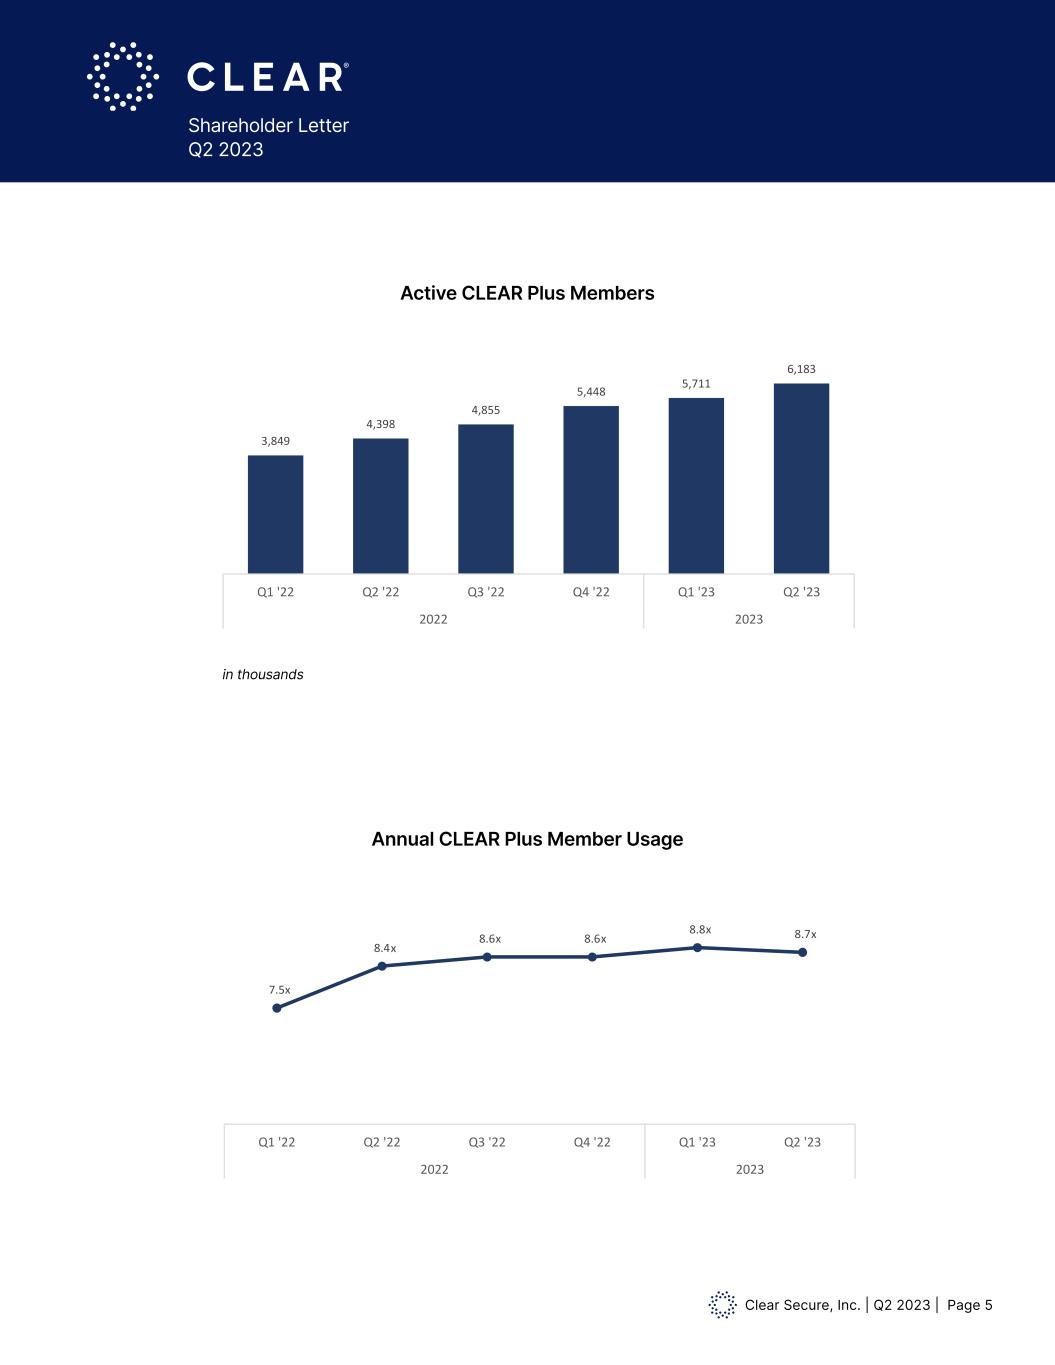
Clear Secure, Inc. | Q2 2023 | Page 2 Shareholder Letter Q2 2023 Second Quarter 2023 Financial Highlights (all figures are for Second Quarter 2023 and percentage change is expressed as year-over-year, unless otherwise specified)* Revenue of $149.9 million was up 45.9% while Total Bookings of $175.1 million were up 42.5% Net cash provided by operating activities of $75.0 million; Free Cash Flow of $66.6 million Total Cumulative Enrollments of 17.4 million were up 32.7% Active CLEAR Plus Members of 6.2 million were up 40.6% (new quarterly KPI) Annual CLEAR Plus Net Member Retention of 90.7% was down 360 basis points year-over-year and 60 basis points sequentially Total Cumulative Platform Uses of 154.3 million were up 44.7% Annual CLEAR Plus Member Usage of 8.7x was up 3.6% (new quarterly KPI) Net income of $8.0 million, Net income per common share basic and diluted of $0.04 Adjusted net income of $22.8 million, Adjusted net income per common share, basic and diluted $0.15 Adjusted EBITDA of $20.0 million Repurchased 1.5 million shares of Class A Common Stock at an average $25.19 per share Established a regular quarterly dividend policy; declared first quarterly dividend of $0.07 to holders of Class A and Class B Common Stock as of August 11, 2023, payable on August 18, 2023 Reached 53 CLEAR Plus airports: launched Tulsa International Airport in July 2023 Working with LinkedIn to expand to other markets later this year * A reconciliation of non-GAAP financial measures to the most comparable GAAP measures is provided at the end of this letter. “ Our second quarter 2023 results demonstrate the strength of our model. We achieved strong top line growth with significant operating leverage. Net income was positive for the first time as a public company while Free Cash Flow grew 62%. We also established a regular quarterly dividend—between opportunistic share repurchase, special dividends and now the regular quarterly dividend our goal is to grow total cash returned to shareholders on an annual basis,” said Caryn Seidman-Becker, CLEAR’s CEO
Clear Secure, Inc. | Q2 2023 | Page 3 Shareholder Letter Q2 2023 in millions in thousands Total Bookings & GAAP Revenue Total Cumulative Enrollments $90.5 $102.7 $115.9 $128.3 $132.4 $149.9 $107.8 $122.9 $145.7 $150.6 $149.7 $175.1 Q1 '22 Q2 '22 Q3 '22 Q4 '22 Q1 '23 Q2 '23 2022 2023 Total GAAP Revenue & Bookings Revenue Total Bookings (10-K) 11,819 13,097 14,236 15,384 16,202 17,385 Q1 '22 Q2 '22 Q3 '22 Q4 '22 Q1 '23 Q2 '23 2022 2023 Total Cumulative Enrollments (Thousands) 95,283 106,631 117,620 129,617 141,106 154,317 Q1 '22 Q2 '22 Q3 '22 Q4 '22 Q1 '23 Q2 '23 2022 2023 Total Cumulative Platform Uses (Thousands) 95.3% 94.3% 92.2% 91.9% 91.3% 90.7% Q1 '22 Q2 '22 Q3 '22 Q4 '22 Q1 '23 Q2 '23 2022 2023 Annual CLEAR Plus Member Retention 3,849 4,398 4,855 5,448 5,711 6,183 Q1 '22 Q2 '22 Q3 '22 Q4 '22 Q1 '23 Q2 '23 2022 2023 Acitve CLEAR Plus Members (Thousands) 7.5 8.4 8.6 8.6 8.8 8.7 Q1 '22 Q2 '22 Q3 '22 Q4 '22 Q1 '23 Q2 '23 2022 2023 Annualized CLEAR Plus Member Usage $90.5 $102.7 $115.9 $128.3 $132.4 $149.9 $107.8 $122.9 $145.7 $150.6 $149.7 $175.1 Q1 '22 Q2 '22 Q3 '22 Q4 '22 Q1 '23 Q2 '23 2022 2023 Total GAAP Revenue & Bookings Revenue Total Bookings (10-K) 11,819 13,097 14,236 15,384 16,202 17,385 Q1 '22 Q2 '22 Q3 '22 Q4 '22 Q1 '23 Q2 '23 2022 2023 Total Cumulative Enrollments (Thousands) 95,283 106,631 117,620 129,617 141,106 154,317 Q1 '22 Q2 '22 Q3 '22 Q4 '22 Q1 '23 Q2 '23 2022 2023 Total Cumulative Platform Uses (Thousands) 95.3% 94.3% 92.2% 91.9% 91.3% 90.7% Q1 '22 Q2 '22 Q3 '22 Q4 '22 Q1 '23 Q2 '23 2022 2023 Annual CLEAR Plus Member Retention 3,849 4,398 4,855 5,448 5,711 6,183 Q1 '22 Q2 '22 Q3 '22 Q4 '22 Q1 '23 Q2 '23 2022 2023 Acitve CLEAR Plus Members (Thousands) 7.5 8.4 8.6 8.6 8.8 8.7 Q1 '22 Q2 '22 Q3 '22 Q4 '22 Q1 '23 Q2 '23 2022 2023 Annualized CLEAR Plus Member Usage
Clear Secure, Inc. | Q2 2023 | Page 4 Shareholder Letter Q2 2023 Total Cumulative Platform Uses Annual CLEAR Plus Net Member Retention in thousands $90.5 $102.7 $115.9 $128.3 $132.4 $149.9 $107.8 $122.9 $145.7 $150.6 $149.7 $175.1 Q1 '22 Q2 '22 Q3 '22 Q4 '22 Q1 '23 Q2 '23 2022 2023 Total GAAP Revenue & Bookings Revenue Total Bookings (10-K) 11,819 13,097 14,236 15,384 16,202 17,385 Q1 '22 Q2 '22 Q3 '22 Q4 '22 Q1 '23 Q2 '23 2022 2023 Total Cumulative Enrollments (Thousands) 95,283 106,631 117,620 129,617 141,106 154,317 Q1 '22 Q2 '22 Q3 '22 Q4 '22 Q1 '23 Q2 '23 2022 2023 Total Cumulative Platform Uses (Thousands) 95.3% 94.3% 92.2% 91.9% 91.3% 90.7% Q1 '22 Q2 '22 Q3 '22 Q4 '22 Q1 '23 Q2 '23 2022 2023 Annual CLEAR Plus Member Retention 3,849 4,398 4,855 5,448 5,711 6,183 Q1 '22 Q2 '22 Q3 '22 Q4 '22 Q1 '23 Q2 '23 2022 2023 Acitve CLEAR Plus Members (Thousands) 7.5 8.4 8.6 8.6 8.8 8.7 Q1 '22 Q2 '22 Q3 '22 Q4 '22 Q1 '23 Q2 '23 2022 2023 Annualized CLEAR Plus Member Usage $90.5 $102.7 $115.9 $128.3 $132.4 $149.9 $107.8 $122.9 $145.7 $150.6 $149.7 $175.1 Q1 '22 Q2 '22 Q3 '22 Q4 '22 Q1 '23 Q2 '23 2022 2023 Total GAAP Revenue & Bookings Revenue Total Bookings (10-K) 11,819 13,097 14,236 15,384 16,202 17,385 Q1 '22 Q2 '22 Q3 '22 Q4 '22 Q1 '23 Q2 '23 2022 2023 Total Cumulative Enrollments (Thousands) 95,283 106,631 117,620 129,617 141,106 154,317 Q1 '22 Q2 '22 Q3 '22 Q4 '22 Q1 '23 Q2 '23 2022 2023 Total Cumulative Platform Uses (Thousands) 95.3% 94.3% 92.2% 91.9% 91.3% 90.7% Q1 '22 Q2 '22 Q3 '22 Q4 '22 Q1 '23 Q2 '23 2022 2023 Annual CLEAR Plus Member Retention 3,849 4,398 4,855 5,448 5,711 6,183 Q1 '22 Q2 '22 Q3 '22 Q4 '22 Q1 '23 Q2 '23 2022 2023 Acitve CLEAR Plus Members (Thousands) 7.5 8.4 8.6 8.6 8.8 8.7 Q1 '22 Q2 '22 Q3 '22 Q4 '22 Q1 '23 Q2 '23 2022 2023 Annualized CLEAR Plus Member Usage
Clear Secure, Inc. | Q2 2023 | Page 5 Shareholder Letter Q2 2023 Active CLEAR Plus Members Annual CLEAR Plus Member Usage in thousands $90.5 $102.7 $115.9 $128.3 $132.4 $149.9 $107.8 $122.9 $145.7 $150.6 $149.7 $175.1 Q1 '22 Q2 '22 Q3 '22 Q4 '22 Q1 '23 Q2 '23 2022 2023 Total GAAP Revenue & Bookings Revenue Total Bookings (10-K) 11,819 13,097 14,236 15,384 16,202 17,385 Q1 '22 Q2 '22 Q3 '22 Q4 '22 Q1 '23 Q2 '23 2022 2023 Total Cumulative Enrollments (Thousands) 95,283 106,631 117,620 129,617 141,106 154,317 Q1 '22 Q2 '22 Q3 '22 Q4 '22 Q1 '23 Q2 '23 2022 2023 Total Cumulative Platform Uses (Thousands) 95.3% 94.3% 92.2% 91.9% 91.3% 90.7% Q1 '22 Q2 '22 Q3 '22 Q4 '22 Q1 '23 Q2 '23 2022 2023 Annual CLEAR Plus Member Retention 3,849 4,398 4,855 5,448 5,711 6,183 Q1 '22 Q2 '22 Q3 '22 Q4 '22 Q1 '23 Q2 '23 2022 2023 Acitve CLEAR Plus Members (Thousands) 7.5 8.4 8.6 8.6 8.8 8.7 Q1 '22 Q2 '22 Q3 '22 Q4 '22 Q1 '23 Q2 '23 2022 2023 Annualized CLEAR Plus Member Usage $90.5 $102.7 $115.9 $128.3 $132.4 $149.9 $107.8 $122.9 $145.7 $150.6 $149.7 $175.1 Q1 '22 Q2 '22 Q3 '22 Q4 '22 Q1 '23 Q2 '23 2022 2023 Total GAAP Revenue & Bookings Revenue Total Bookings (10-K) 11,819 13,097 14,236 15,384 16,202 17,385 Q1 '22 Q2 '22 Q3 '22 Q4 '22 Q1 '23 Q2 '23 2022 2023 Total Cumulative Enrollments (Thousands) 95,283 106,631 117,620 129,617 141,106 154,317 Q1 '22 Q2 '22 Q3 '22 Q4 '22 Q1 '23 Q2 '23 2022 2023 Total Cumulative Platform Uses (Thousands) 95.3% 94.3% 92.2% 91.9% 91.3% 90.7% Q1 '22 Q2 '22 Q3 '22 Q4 '22 Q1 '23 Q2 '23 2022 2023 Annual CLEAR Plus Member Retention 3,849 4,398 4,855 5,448 5,711 6,183 Q1 '22 Q2 '22 Q3 '22 Q4 '22 Q1 '23 Q2 '23 2022 2023 Acitve CLEAR Plus Members (Thousands) 7.5 8.4 8.6 8.6 8.8 8.7 Q1 '22 Q2 '22 Q3 '22 Q4 '22 Q1 '23 Q2 '23 2022 2023 Annualized CLEAR Plus Member Usage x x x x x x
Clear Secure, Inc. | Q2 2023 | Page 6 Shareholder Letter Q2 2023 Dear Shareholder, CLEAR celebrated our two-year anniversary as a public company on June 30th. Our IPO roadshow focused on how identity is foundational to unlocking friction-free experiences and how CLEAR’s secure identity platform extends broadly into travel and beyond. As we work to make CLEAR a daily habit, it is the right moment to review where we have been, where we are going, our business model and our capital allocation philosophy. We continue to believe that travel has undergone a structural shift in demand post-pandemic. Initially we saw a strong “COVID bounce”, however eight quarters in, with bookings growth of 42.5% this quarter it is evident that travelers value CLEAR more than ever. The CLEAR member base is expanding beyond the traditional road warrior, evidenced by new geographies, a younger demographic and weekly and seasonal travel patterns very different from the past. CLEAR has become the trusted brand for predictable and friction-free travel experiences. In addition, travel is hard and getting harder. By 2030 we expect one million more travelers traversing US airports every day (a 3% CAGR from 2019 levels). Technology and innovation must be part of the solution and we are committed to supporting our partners in this challenge. In 2010, we believed in the consumerization of biometrics to make experiences safer and easier—today, the global travel industry agrees. Over the past few years our focus has expanded to leveraging biometric innovation to transform the travel experience from home to gate with security and customer obsession at the core—CLEAR is on the side of the traveler. The CLEAR ID is universal—travelers enroll once and whether in the cloud or on device—across airlines, airports and use cases—when you are dropping your bag, going through security, or entering the lounge—you are always you. The “CLEAR lane of the future” is on the horizon. Since 2020, we’ve been collaborating with the Department of Homeland Security on digital identity innovation and integration with TSA’s next generation hardware. A more friction-free experience will electronically transmit a CLEAR member’s credential (digital identity) to TSA’s next-gen hardware for seamless and secure entry into physical screening, without the need for an ID. Additionally, new digital ID industry standards allow for mobile enrollments and we will transition from fingerprint and iris as the primary biometric to face. With one million more travelers per day—these efficiency gains will be extremely important for travelers and for CLEAR. We remain excited about TSA PreCheck® Enrollment Provided by CLEAR. We believe we will drive significant growth in the program through expanded availability and easy access. The launch should be accretive to margins going forward, as we have been carrying significant overhead for this program for several years. With CLEAR Plus, RESERVE powered by CLEAR, TSA PreCheck® Enrollment Provided by CLEAR, and our home to gate innovations—we are focused on serving all travelers whether they travel once a year or once a week.
Clear Secure, Inc. | Q2 2023 | Page 7 Shareholder Letter Q2 2023 CLEAR Verified (formerly Powered By CLEAR) is our nascent B2B business. The ability to authenticate your identity once and use it everywhere is the power of CLEAR’s secure identity platform—for our members and for our partners. With CLEAR, you are you every time, everywhere. These are early days for the digital identity industry. As the world moves online—identity and trust are paramount and there are countless use cases for CLEAR’s platform. Online platforms such as our partner LinkedIn are increasingly focused on confirming the identity of their user base to increase trust and reduce fraud. We are working with LinkedIn to expand to other markets later this year, as we have added localization capabilities to our platform. Healthcare service businesses want to improve customer and employee experience and drive efficiencies by leveraging digital identities to streamline check-in, login and account management (our partner University of Miami Health System speaks about our value proposition here). We also see opportunity in the financial services space as businesses are looking for ways to improve their Know Your Customer (“KYC”) processes. CLEAR’s networked identity supports businesses by authenticating an individual upfront and enabling that individual to leverage their identity across multiple partners. Our growing base of over 17 million members accelerates adoption for our partners at a lower cost. Since going public, our team has executed well—expanding our network, our products, and our partners. We have grown from 38 CLEAR Plus airports to 53, and 18 airports with RESERVE powered by CLEAR. Total Cumulative Enrollments have increased from 6.3 million to 17.4 million members, trailing 12-month Free Cash Flow has grown from $11 million to $194 million and we are on track to more than double 2021 bookings this year. We have consistently highlighted the three business metrics we believe are key to maximizing long-term shareholder value—members, bookings and Free Cash Flow. Sometimes we make near term trade offs. For example we have been investing in CLEAR Verified and TSA PreCheck® Enrollment Provided by CLEAR since 2020, which have impacted our margins. We remain committed to the long-term 35% Adjusted EBITDA margin target we laid out in our IPO roadshow. While we have made good progress since 2021 we expect high incremental margins in the future as TSA PreCheck® Enrollment Provided by CLEAR launches and platform bookings ramp while growth in these investments slow materially. As owner-operators (we own ~18% of total shares outstanding) we are highly aligned with CLEAR shareholders—we will optimize the levers of the business and make capital allocation decisions accordingly. With $773 million of cash on the balance sheet, capital allocation is a big deal. We have significant optionality to invest in organic and inorganic opportunities while returning excess capital to shareholders. In the last 12 months we have returned ~$120 million to shareholders in the form of share repurchase and distributions.
Clear Secure, Inc. | Q2 2023 | Page 8 Shareholder Letter Q2 2023 We are excited for the next chapter of our capital allocation journey with today’s announcement of a regular quarterly dividend. On top of this regular dividend, we plan to return additional capital to shareholders on an opportunistic basis, which may include special cash dividends and share repurchases. Our goal is to grow total cash returned to shareholders on an annual basis over time. We remain focused on growing members, bookings, AND Free Cash Flow, while continuing to build a brand that members AND partners trust and love. Best,
Clear Secure, Inc. | Q2 2023 | Page 9 Shareholder Letter Q2 2023 Second quarter 2023 Revenue of $149.9 million grew 45.9% as compared to the second quarter of 2022 while Total Bookings of $175.1 million grew 42.5%. We saw a continuation of the strong travel trends driving both membership growth and net retention, leading to better-than-expected Total Bookings growth. Our in-airport and partner channels continued to perform well. Second quarter 2023 Total Cumulative Enrollments reached 17.4 million, driven primarily by an increase in CLEAR Plus enrollments at existing and new airports, as well as contributions from CLEAR Verified. Second quarter 2023 Active CLEAR Plus Members reached 6.2 million, up 40.6% as compared to the second quarter of 2022 driven by new members added through airport, partner and organic channels in existing and new markets. As this is a new quarterly KPI, historical figures have been included for reference in the Appendix for periods beginning with the first quarter of 2021. Second quarter 2023 Total Cumulative Platform Uses reached 154.3 million, driven by the continued strength in air travel leading to increases in CLEAR Plus verifications. Second quarter 2023 Annual CLEAR Plus Member Usage was 8.7x, up 3.6% as compared to the second quarter of 2022. As this is a new quarterly KPI, historical figures have been included for reference in the Appendix for periods beginning with the first quarter of 2021. Second quarter 2023 Annual CLEAR Plus Net Member Retention was 90.7%, down 360 basis points year-over-year and down 60 basis points sequentially. The decline continues to be driven by a normalization of winback activity from pandemic levels. As previously discussed, we expect long-term Annual CLEAR Plus Net Member Retention to settle in the upper 80s percentage range, above pre-pandemic levels. Cost of revenue share fee was $21.2 million in the second quarter of 2023 and includes a COVID-related benefit of $0.3 million. Excluding COVID-related benefits in all periods, cost of revenue share fee as a percentage of revenue was up 102 basis points year-over-year and down 87 basis points sequentially. Cost of revenue share percentage may vary by quarter, but on an annual basis we expect it to remain relatively stable over time. Cost of direct salaries and benefits were $34.2 million in the second quarter of 2023, up 35.1% year-over-year, and up 3.2% sequentially. As a percentage of revenue, cost of direct salaries and benefits was down 182 basis points year-over-year and down 222 basis points sequentially. Year-over-year growth was driven by nine new airport launches since the second quarter 2022 and higher travel volumes leading to higher staffing needs. Second Quarter 2023 Financial Discussion
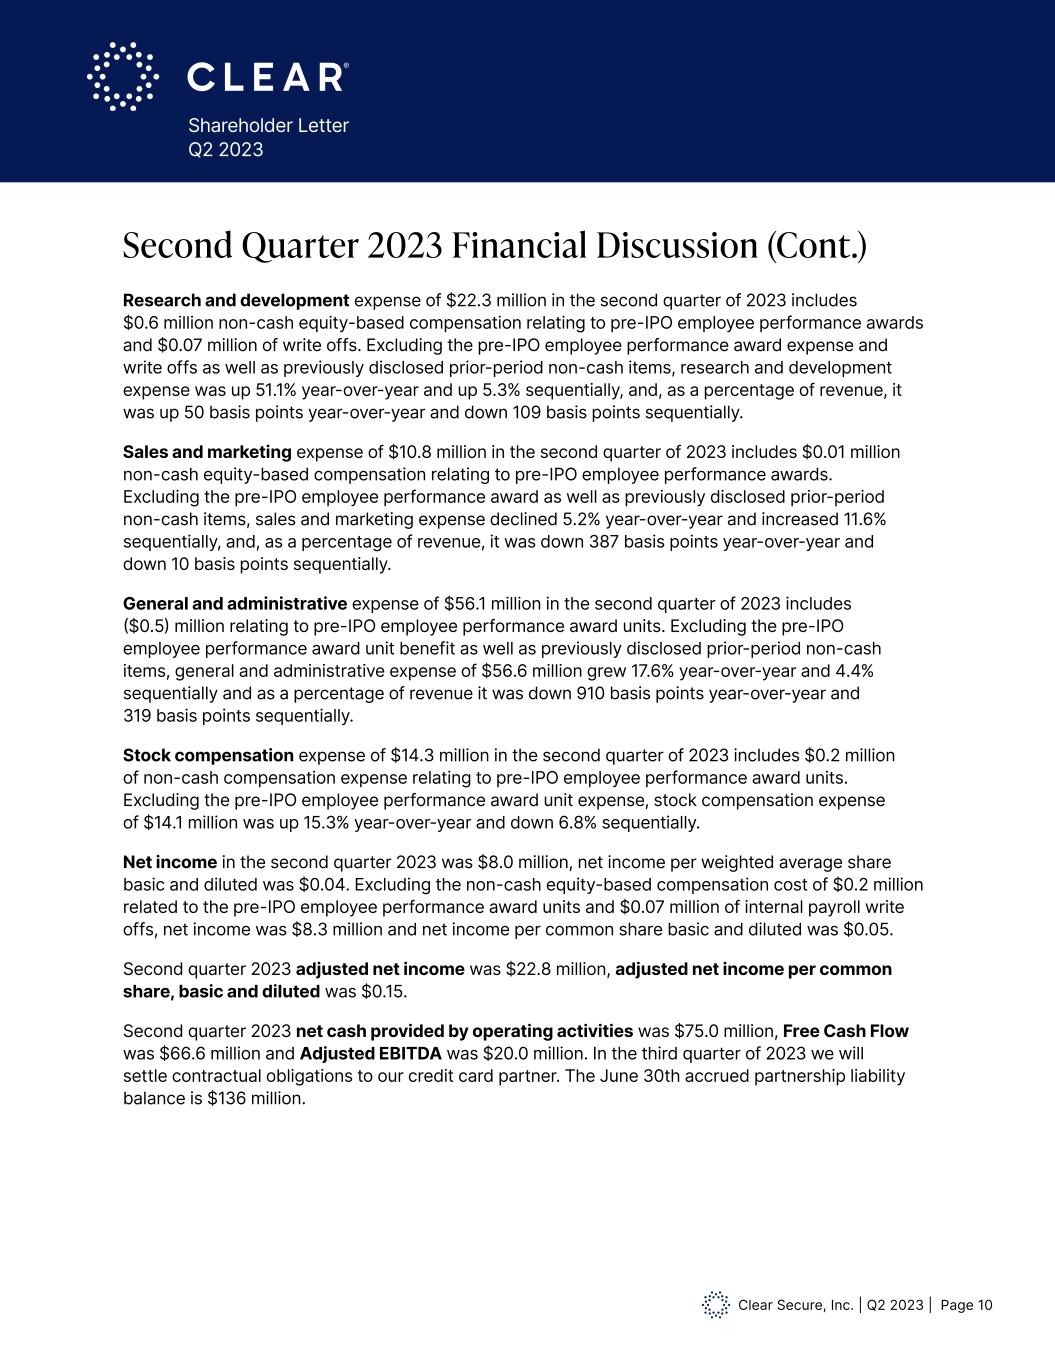
Clear Secure, Inc. | Q2 2023 | Page 10 Shareholder Letter Q2 2023 Research and development expense of $22.3 million in the second quarter of 2023 includes $0.6 million non-cash equity-based compensation relating to pre-IPO employee performance awards and $0.07 million of write offs. Excluding the pre-IPO employee performance award expense and write offs as well as previously disclosed prior-period non-cash items, research and development expense was up 51.1% year-over-year and up 5.3% sequentially, and, as a percentage of revenue, it was up 50 basis points year-over-year and down 109 basis points sequentially. Sales and marketing expense of $10.8 million in the second quarter of 2023 includes $0.01 million non-cash equity-based compensation relating to pre-IPO employee performance awards. Excluding the pre-IPO employee performance award as well as previously disclosed prior-period non-cash items, sales and marketing expense declined 5.2% year-over-year and increased 11.6% sequentially, and, as a percentage of revenue, it was down 387 basis points year-over-year and down 10 basis points sequentially. General and administrative expense of $56.1 million in the second quarter of 2023 includes ($0.5) million relating to pre-IPO employee performance award units. Excluding the pre-IPO employee performance award unit benefit as well as previously disclosed prior-period non-cash items, general and administrative expense of $56.6 million grew 17.6% year-over-year and 4.4% sequentially and as a percentage of revenue it was down 910 basis points year-over-year and 319 basis points sequentially. Stock compensation expense of $14.3 million in the second quarter of 2023 includes $0.2 million of non-cash compensation expense relating to pre-IPO employee performance award units. Excluding the pre-IPO employee performance award unit expense, stock compensation expense of $14.1 million was up 15.3% year-over-year and down 6.8% sequentially. Net income in the second quarter 2023 was $8.0 million, net income per weighted average share basic and diluted was $0.04. Excluding the non-cash equity-based compensation cost of $0.2 million related to the pre-IPO employee performance award units and $0.07 million of internal payroll write offs, net income was $8.3 million and net income per common share basic and diluted was $0.05. Second quarter 2023 adjusted net income was $22.8 million, adjusted net income per common share, basic and diluted was $0.15. Second quarter 2023 net cash provided by operating activities was $75.0 million, Free Cash Flow was $66.6 million and Adjusted EBITDA was $20.0 million. In the third quarter of 2023 we will settle contractual obligations to our credit card partner. The June 30th accrued partnership liability balance is $136 million. Second Quarter 2023 Financial Discussion (Cont.)
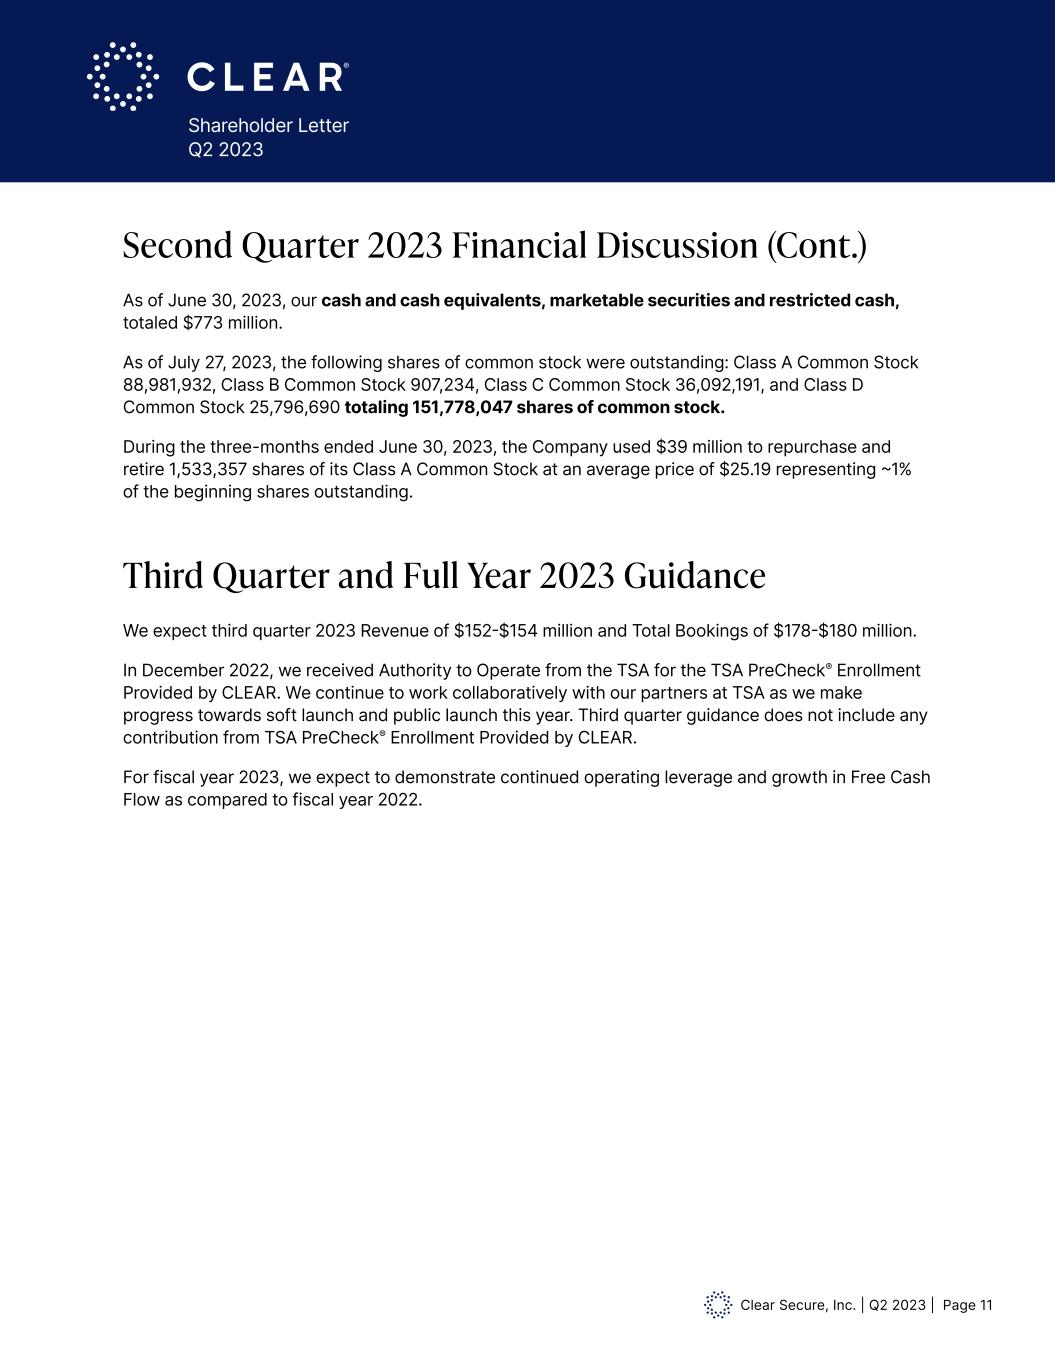
Clear Secure, Inc. | Q2 2023 | Page 11 Shareholder Letter Q2 2023 As of June 30, 2023, our cash and cash equivalents, marketable securities and restricted cash, totaled $773 million. As of July 27, 2023, the following shares of common stock were outstanding: Class A Common Stock 88,981,932, Class B Common Stock 907,234, Class C Common Stock 36,092,191, and Class D Common Stock 25,796,690 totaling 151,778,047 shares of common stock. During the three-months ended June 30, 2023, the Company used $39 million to repurchase and retire 1,533,357 shares of its Class A Common Stock at an average price of $25.19 representing ~1% of the beginning shares outstanding. Second Quarter 2023 Financial Discussion (Cont.) Third Quarter and Full Year 2023 Guidance We expect third quarter 2023 Revenue of $152-$154 million and Total Bookings of $178-$180 million. In December 2022, we received Authority to Operate from the TSA for the TSA PreCheck® Enrollment Provided by CLEAR. We continue to work collaboratively with our partners at TSA as we make progress towards soft launch and public launch this year. Third quarter guidance does not include any contribution from TSA PreCheck® Enrollment Provided by CLEAR. For fiscal year 2023, we expect to demonstrate continued operating leverage and growth in Free Cash Flow as compared to fiscal year 2022.
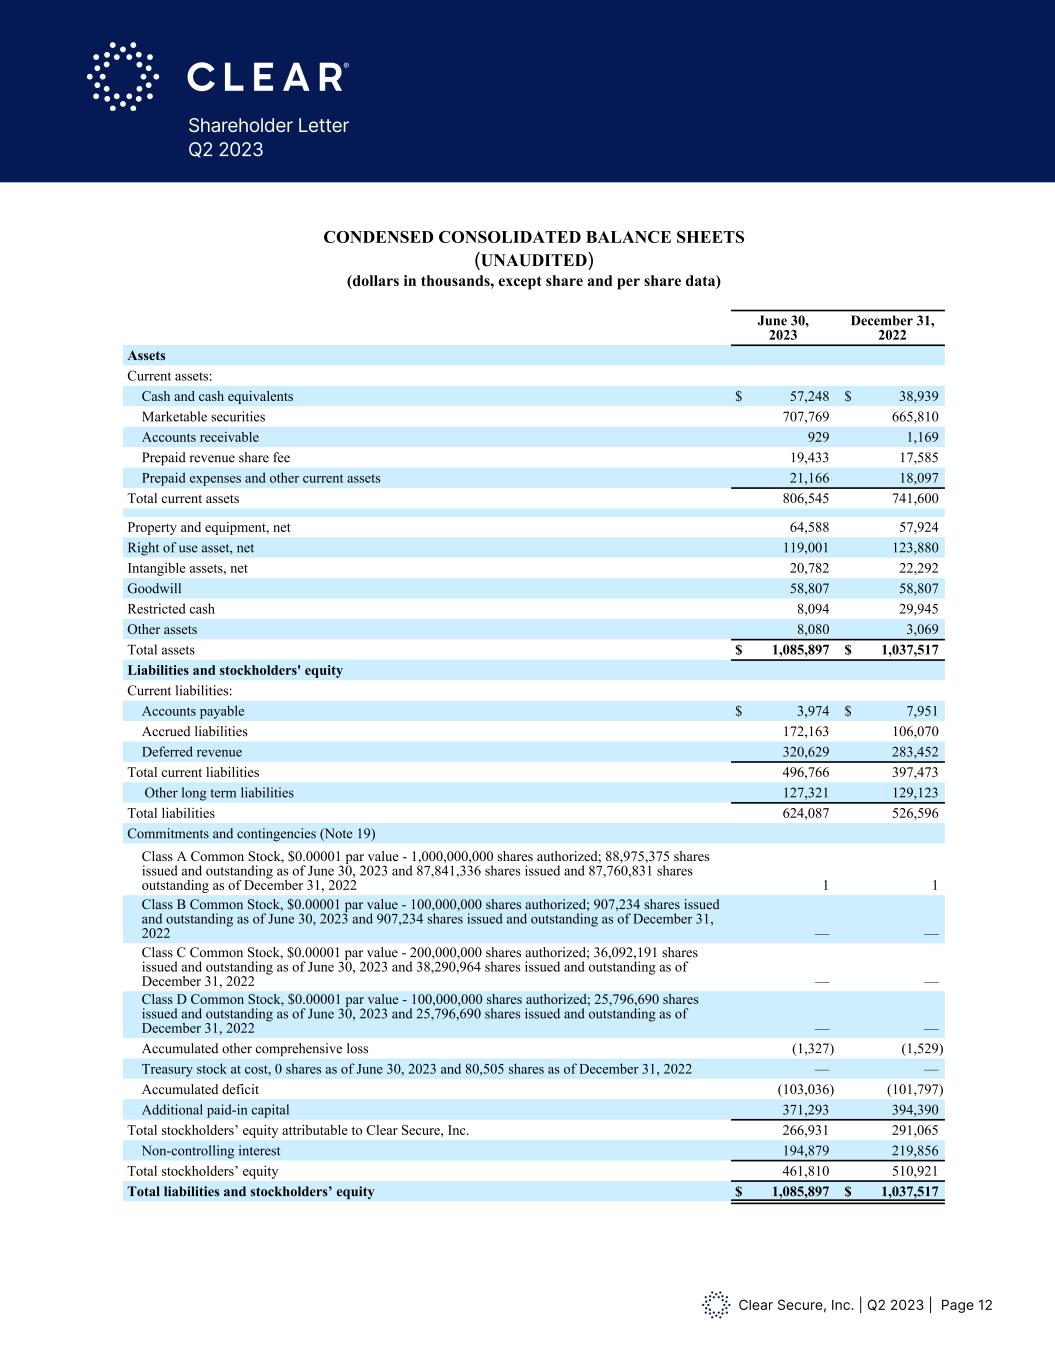
Clear Secure, Inc. | Q2 2023 | Page 12 Shareholder Letter Q2 2023 CONDENSED CONSOLIDATED BALANCE SHEETS (UNAUDITED) (dollars in thousands, except share and per share data) June 30, 2023 December 31, 2022 Assets Current assets: Cash and cash equivalents $ 57,248 $ 38,939 Marketable securities 707,769 665,810 Accounts receivable 929 1,169 Prepaid revenue share fee 19,433 17,585 Prepaid expenses and other current assets 21,166 18,097 Total current assets 806,545 741,600 Property and equipment, net 64,588 57,924 Right of use asset, net 119,001 123,880 Intangible assets, net 20,782 22,292 Goodwill 58,807 58,807 Restricted cash 8,094 29,945 Other assets 8,080 3,069 Total assets $ 1,085,897 $ 1,037,517 Liabilities and stockholders' equity Current liabilities: Accounts payable $ 3,974 $ 7,951 Accrued liabilities 172,163 106,070 Deferred revenue 320,629 283,452 Total current liabilities 496,766 397,473 Other long term liabilities 127,321 129,123 Total liabilities 624,087 526,596 Commitments and contingencies (Note 19) Class A Common Stock, $0.00001 par value - 1,000,000,000 shares authorized; 88,975,375 shares issued and outstanding as of June 30, 2023 and 87,841,336 shares issued and 87,760,831 shares outstanding as of December 31, 2022 1 1 Class B Common Stock, $0.00001 par value - 100,000,000 shares authorized; 907,234 shares issued and outstanding as of June 30, 2023 and 907,234 shares issued and outstanding as of December 31, 2022 — — Class C Common Stock, $0.00001 par value - 200,000,000 shares authorized; 36,092,191 shares issued and outstanding as of June 30, 2023 and 38,290,964 shares issued and outstanding as of December 31, 2022 — — Class D Common Stock, $0.00001 par value - 100,000,000 shares authorized; 25,796,690 shares issued and outstanding as of June 30, 2023 and 25,796,690 shares issued and outstanding as of December 31, 2022 — — Accumulated other comprehensive loss (1,327) (1,529) Treasury stock at cost, 0 shares as of June 30, 2023 and 80,505 shares as of December 31, 2022 — — Accumulated deficit (103,036) (101,797) Additional paid-in capital 371,293 394,390 Total stockholders’ equity attributable to Clear Secure, Inc. 266,931 291,065 Non-controlling interest 194,879 219,856 Total stockholders’ equity 461,810 510,921 Total liabilities and stockholders’ equity $ 1,085,897 $ 1,037,517
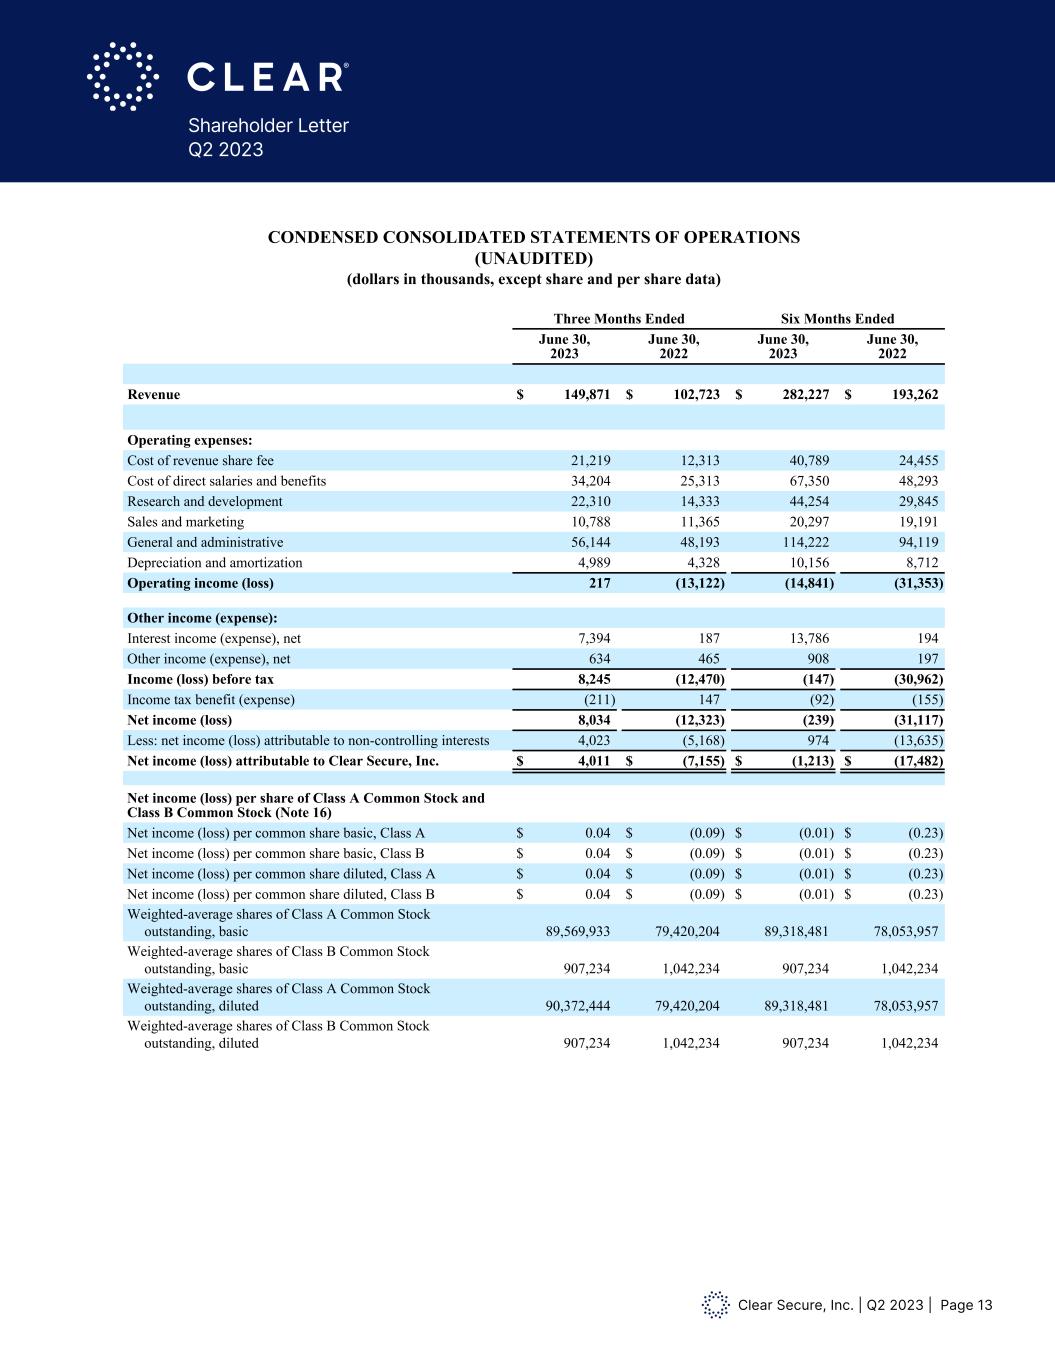
Clear Secure, Inc. | Q2 2023 | Page 13 Shareholder Letter Q2 2023 CONDENSED CONSOLIDATED STATEMENTS OF OPERATIONS (UNAUDITED) (dollars in thousands, except share and per share data) Three Months Ended Six Months Ended June 30, 2023 June 30, 2022 June 30, 2023 June 30, 2022 Revenue $ 149,871 $ 102,723 $ 282,227 $ 193,262 Operating expenses: Cost of revenue share fee 21,219 12,313 40,789 24,455 Cost of direct salaries and benefits 34,204 25,313 67,350 48,293 Research and development 22,310 14,333 44,254 29,845 Sales and marketing 10,788 11,365 20,297 19,191 General and administrative 56,144 48,193 114,222 94,119 Depreciation and amortization 4,989 4,328 10,156 8,712 Operating income (loss) 217 (13,122) (14,841) (31,353) Other income (expense): Interest income (expense), net 7,394 187 13,786 194 Other income (expense), net 634 465 908 197 Income (loss) before tax 8,245 (12,470) (147) (30,962) Income tax benefit (expense) (211) 147 (92) (155) Net income (loss) 8,034 (12,323) (239) (31,117) Less: net income (loss) attributable to non-controlling interests 4,023 (5,168) 974 (13,635) Net income (loss) attributable to Clear Secure, Inc. $ 4,011 $ (7,155) $ (1,213) $ (17,482) Net income (loss) per share of Class A Common Stock and Class B Common Stock (Note 16) Net income (loss) per common share basic, Class A $ 0.04 $ (0.09) $ (0.01) $ (0.23) Net income (loss) per common share basic, Class B $ 0.04 $ (0.09) $ (0.01) $ (0.23) Net income (loss) per common share diluted, Class A $ 0.04 $ (0.09) $ (0.01) $ (0.23) Net income (loss) per common share diluted, Class B $ 0.04 $ (0.09) $ (0.01) $ (0.23) Weighted-average shares of Class A Common Stock outstanding, basic 89,569,933 79,420,204 89,318,481 78,053,957 Weighted-average shares of Class B Common Stock outstanding, basic 907,234 1,042,234 907,234 1,042,234 Weighted-average shares of Class A Common Stock outstanding, diluted 90,372,444 79,420,204 89,318,481 78,053,957 Weighted-average shares of Class B Common Stock outstanding, diluted 907,234 1,042,234 907,234 1,042,234
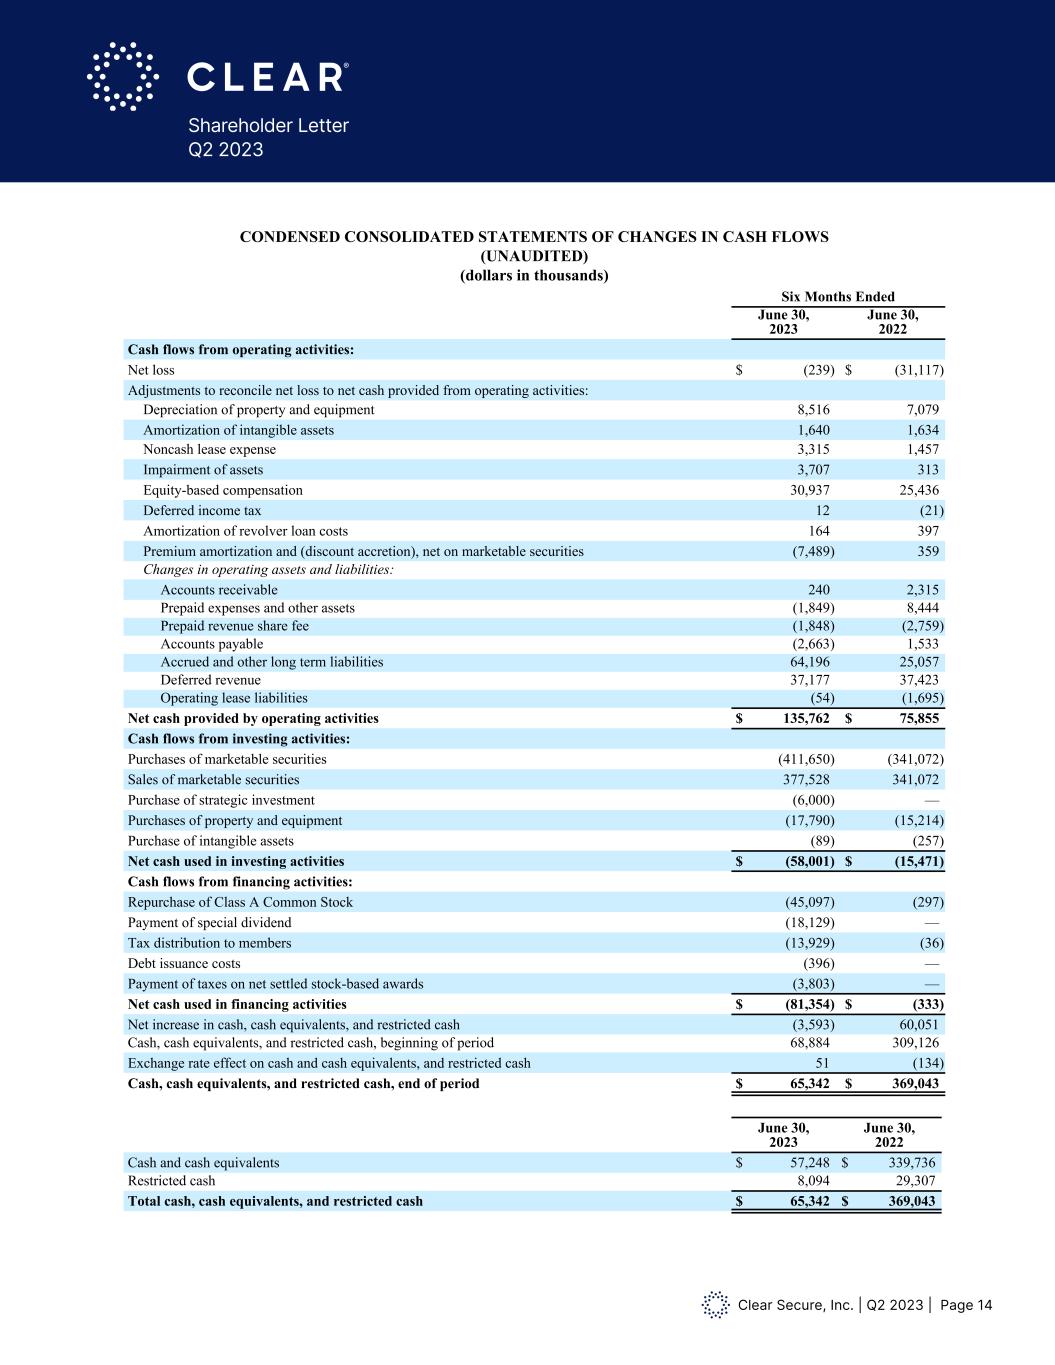
Clear Secure, Inc. | Q2 2023 | Page 14 Shareholder Letter Q2 2023 CONDENSED CONSOLIDATED STATEMENTS OF CHANGES IN CASH FLOWS (UNAUDITED) (dollars in thousands) Six Months Ended June 30, 2023 June 30, 2022 Cash flows from operating activities: Net loss $ (239) $ (31,117) Adjustments to reconcile net loss to net cash provided from operating activities: Depreciation of property and equipment 8,516 7,079 Amortization of intangible assets 1,640 1,634 Noncash lease expense 3,315 1,457 Impairment of assets 3,707 313 Equity-based compensation 30,937 25,436 Deferred income tax 12 (21) Amortization of revolver loan costs 164 397 Premium amortization and (discount accretion), net on marketable securities (7,489) 359 Changes in operating assets and liabilities: Accounts receivable 240 2,315 Prepaid expenses and other assets (1,849) 8,444 Prepaid revenue share fee (1,848) (2,759) Accounts payable (2,663) 1,533 Accrued and other long term liabilities 64,196 25,057 Deferred revenue 37,177 37,423 Operating lease liabilities (54) (1,695) Net cash provided by operating activities $ 135,762 $ 75,855 Cash flows from investing activities: Purchases of marketable securities (411,650) (341,072) Sales of marketable securities 377,528 341,072 Purchase of strategic investment (6,000) — Purchases of property and equipment (17,790) (15,214) Purchase of intangible assets (89) (257) Net cash used in investing activities $ (58,001) $ (15,471) Cash flows from financing activities: Repurchase of Class A Common Stock (45,097) (297) Payment of special dividend (18,129) — Tax distribution to members (13,929) (36) Debt issuance costs (396) — Payment of taxes on net settled stock-based awards (3,803) — Net cash used in financing activities $ (81,354) $ (333) Net increase in cash, cash equivalents, and restricted cash (3,593) 60,051 Cash, cash equivalents, and restricted cash, beginning of period 68,884 309,126 Exchange rate effect on cash and cash equivalents, and restricted cash 51 (134) Cash, cash equivalents, and restricted cash, end of period $ 65,342 $ 369,043 June 30, 2023 June 30, 2022 Cash and cash equivalents $ 57,248 $ 339,736 Restricted cash 8,094 29,307 Total cash, cash equivalents, and restricted cash $ 65,342 $ 369,043
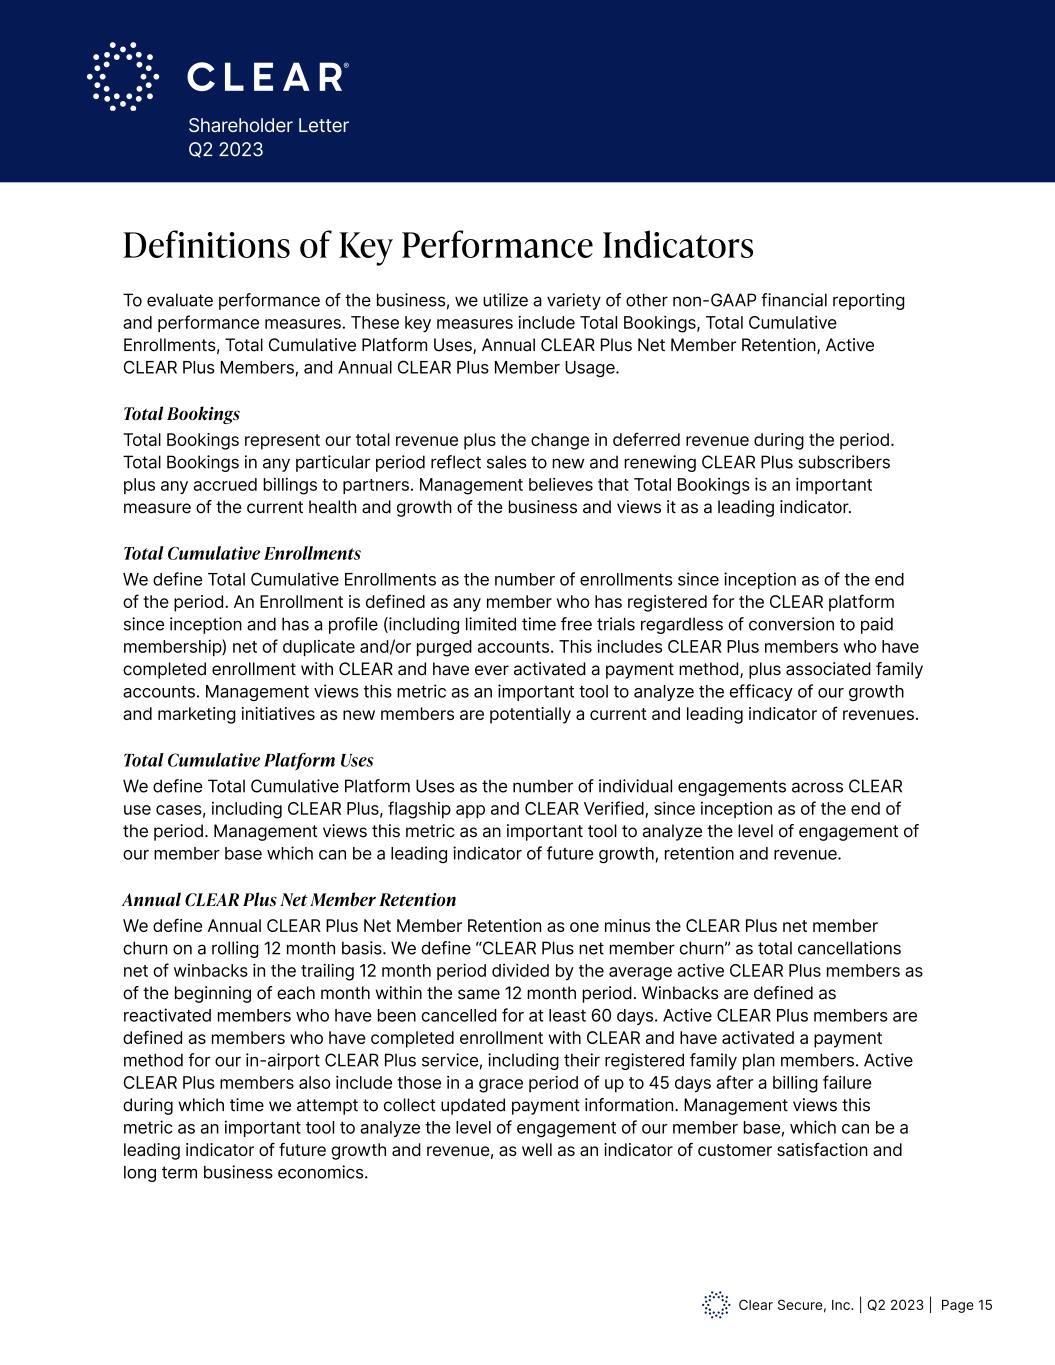
Clear Secure, Inc. | Q2 2023 | Page 15 Shareholder Letter Q2 2023 To evaluate performance of the business, we utilize a variety of other non-GAAP financial reporting and performance measures. These key measures include Total Bookings, Total Cumulative Enrollments, Total Cumulative Platform Uses, Annual CLEAR Plus Net Member Retention, Active CLEAR Plus Members, and Annual CLEAR Plus Member Usage. Total Bookings Total Bookings represent our total revenue plus the change in deferred revenue during the period. Total Bookings in any particular period reflect sales to new and renewing CLEAR Plus subscribers plus any accrued billings to partners. Management believes that Total Bookings is an important measure of the current health and growth of the business and views it as a leading indicator. Total Cumulative Enrollments We define Total Cumulative Enrollments as the number of enrollments since inception as of the end of the period. An Enrollment is defined as any member who has registered for the CLEAR platform since inception and has a profile (including limited time free trials regardless of conversion to paid membership) net of duplicate and/or purged accounts. This includes CLEAR Plus members who have completed enrollment with CLEAR and have ever activated a payment method, plus associated family accounts. Management views this metric as an important tool to analyze the efficacy of our growth and marketing initiatives as new members are potentially a current and leading indicator of revenues. Total Cumulative Platform Uses We define Total Cumulative Platform Uses as the number of individual engagements across CLEAR use cases, including CLEAR Plus, flagship app and CLEAR Verified, since inception as of the end of the period. Management views this metric as an important tool to analyze the level of engagement of our member base which can be a leading indicator of future growth, retention and revenue. Annual CLEAR Plus Net Member Retention We define Annual CLEAR Plus Net Member Retention as one minus the CLEAR Plus net member churn on a rolling 12 month basis. We define “CLEAR Plus net member churn” as total cancellations net of winbacks in the trailing 12 month period divided by the average active CLEAR Plus members as of the beginning of each month within the same 12 month period. Winbacks are defined as reactivated members who have been cancelled for at least 60 days. Active CLEAR Plus members are defined as members who have completed enrollment with CLEAR and have activated a payment method for our in-airport CLEAR Plus service, including their registered family plan members. Active CLEAR Plus members also include those in a grace period of up to 45 days after a billing failure during which time we attempt to collect updated payment information. Management views this metric as an important tool to analyze the level of engagement of our member base, which can be a leading indicator of future growth and revenue, as well as an indicator of customer satisfaction and long term business economics. Definitions of Key Performance Indicators
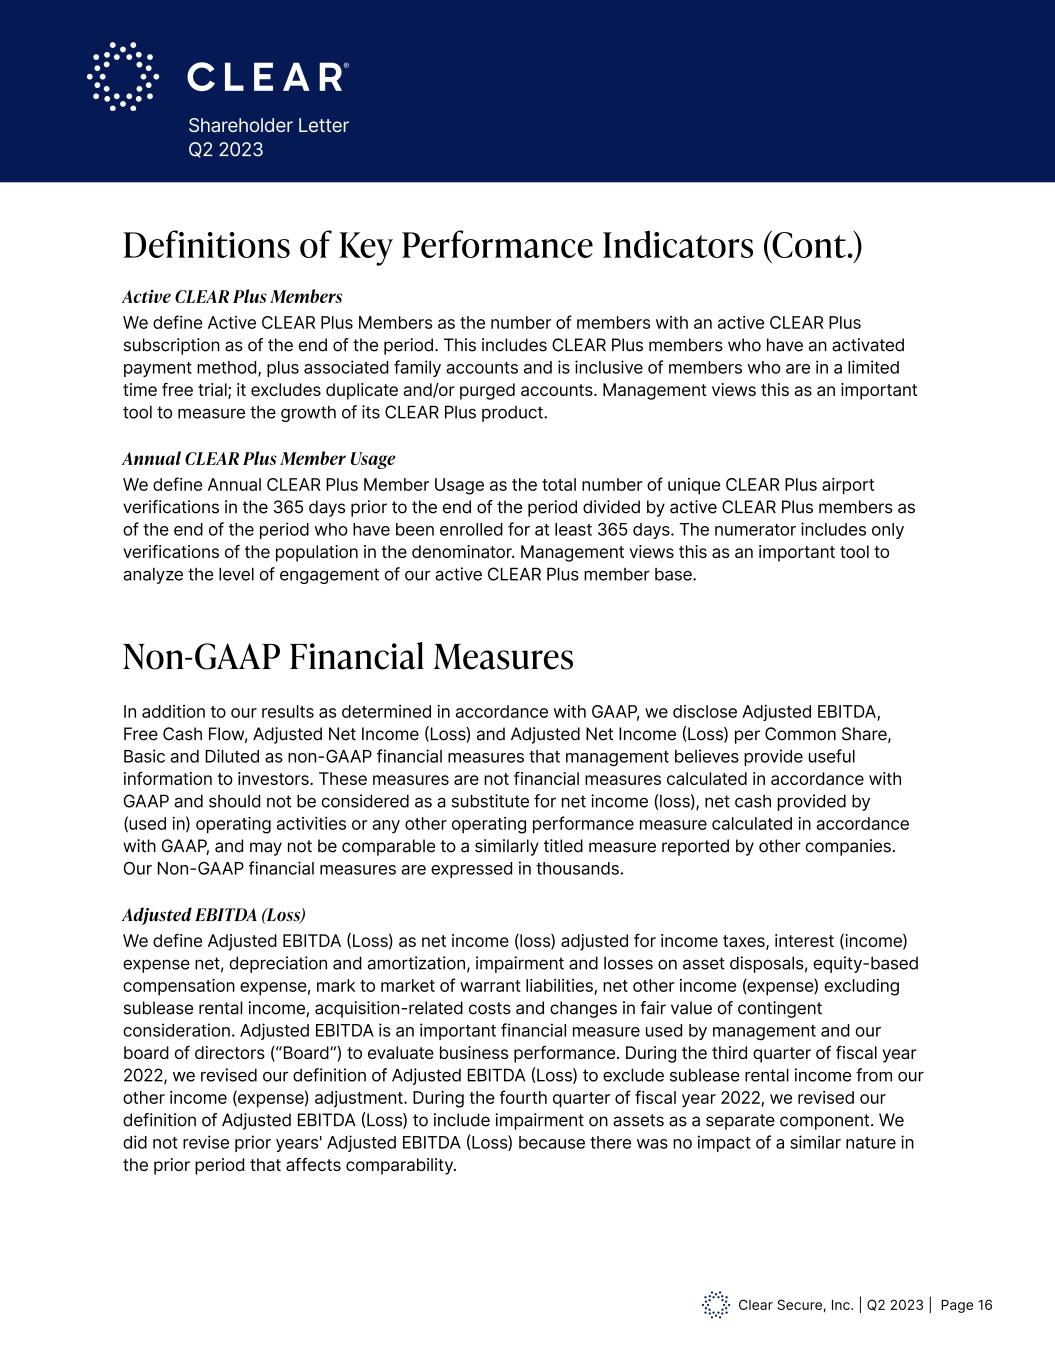
Clear Secure, Inc. | Q2 2023 | Page 16 Shareholder Letter Q2 2023 In addition to our results as determined in accordance with GAAP, we disclose Adjusted EBITDA, Free Cash Flow, Adjusted Net Income (Loss) and Adjusted Net Income (Loss) per Common Share, Basic and Diluted as non-GAAP financial measures that management believes provide useful information to investors. These measures are not financial measures calculated in accordance with GAAP and should not be considered as a substitute for net income (loss), net cash provided by (used in) operating activities or any other operating performance measure calculated in accordance with GAAP, and may not be comparable to a similarly titled measure reported by other companies. Our Non-GAAP financial measures are expressed in thousands. Adjusted EBITDA (Loss) We define Adjusted EBITDA (Loss) as net income (loss) adjusted for income taxes, interest (income) expense net, depreciation and amortization, impairment and losses on asset disposals, equity-based compensation expense, mark to market of warrant liabilities, net other income (expense) excluding sublease rental income, acquisition-related costs and changes in fair value of contingent consideration. Adjusted EBITDA is an important financial measure used by management and our board of directors (“Board”) to evaluate business performance. During the third quarter of fiscal year 2022, we revised our definition of Adjusted EBITDA (Loss) to exclude sublease rental income from our other income (expense) adjustment. During the fourth quarter of fiscal year 2022, we revised our definition of Adjusted EBITDA (Loss) to include impairment on assets as a separate component. We did not revise prior years' Adjusted EBITDA (Loss) because there was no impact of a similar nature in the prior period that affects comparability. Non-GAAP Financial Measures Active CLEAR Plus Members We define Active CLEAR Plus Members as the number of members with an active CLEAR Plus subscription as of the end of the period. This includes CLEAR Plus members who have an activated payment method, plus associated family accounts and is inclusive of members who are in a limited time free trial; it excludes duplicate and/or purged accounts. Management views this as an important tool to measure the growth of its CLEAR Plus product. Annual CLEAR Plus Member Usage We define Annual CLEAR Plus Member Usage as the total number of unique CLEAR Plus airport verifications in the 365 days prior to the end of the period divided by active CLEAR Plus members as of the end of the period who have been enrolled for at least 365 days. The numerator includes only verifications of the population in the denominator. Management views this as an important tool to analyze the level of engagement of our active CLEAR Plus member base. Definitions of Key Performance Indicators (Cont.)
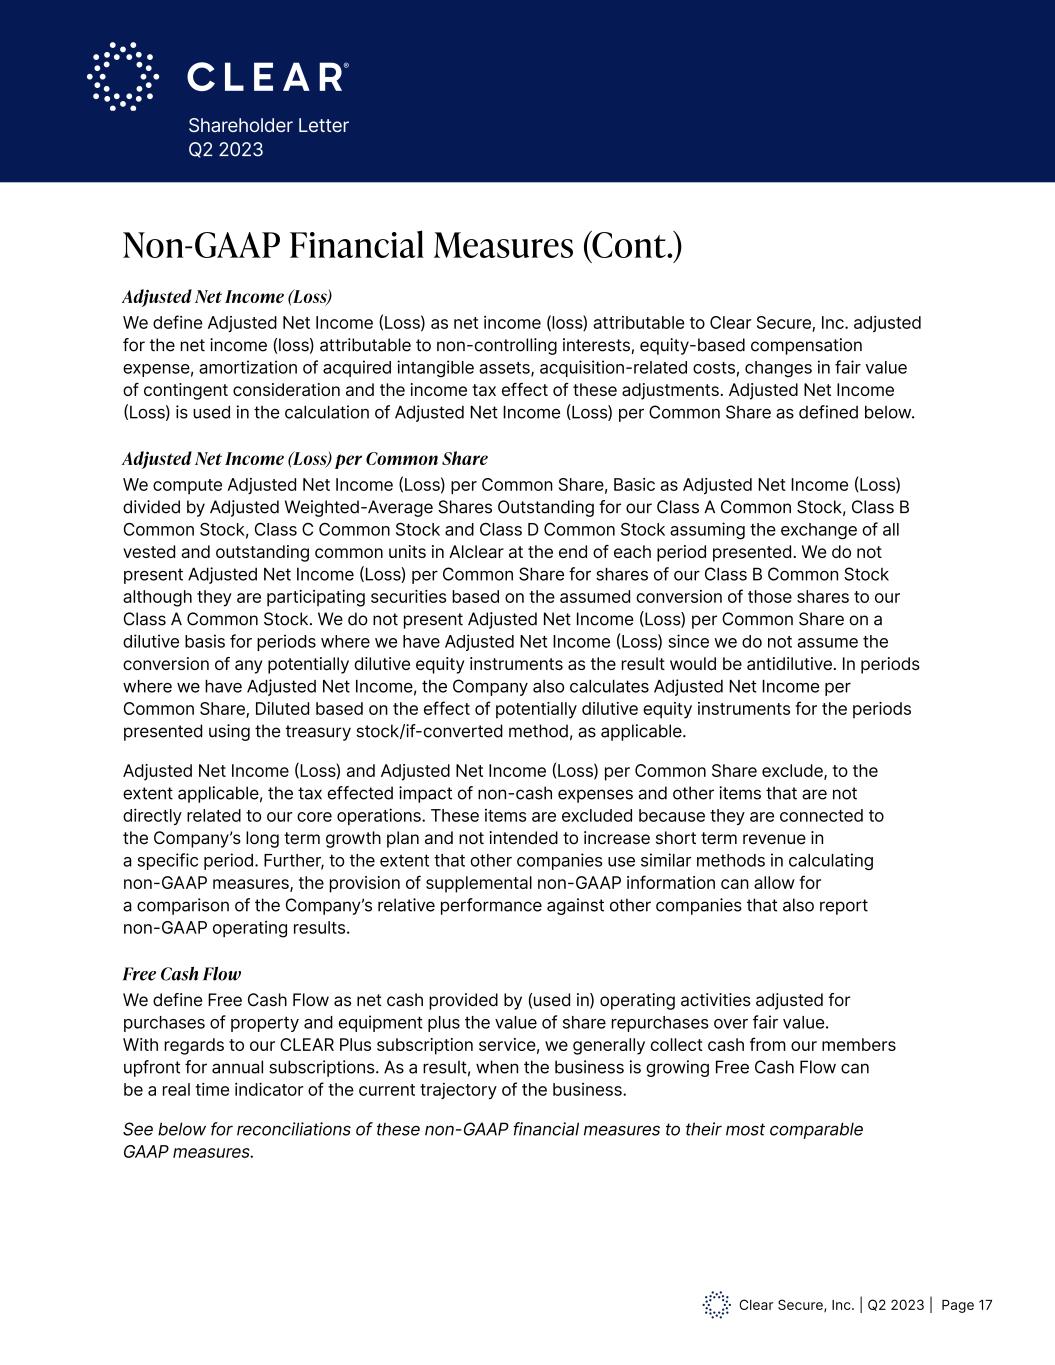
Clear Secure, Inc. | Q2 2023 | Page 17 Shareholder Letter Q2 2023 Adjusted Net Income (Loss) We define Adjusted Net Income (Loss) as net income (loss) attributable to Clear Secure, Inc. adjusted for the net income (loss) attributable to non-controlling interests, equity-based compensation expense, amortization of acquired intangible assets, acquisition-related costs, changes in fair value of contingent consideration and the income tax effect of these adjustments. Adjusted Net Income (Loss) is used in the calculation of Adjusted Net Income (Loss) per Common Share as defined below. Adjusted Net Income (Loss) per Common Share We compute Adjusted Net Income (Loss) per Common Share, Basic as Adjusted Net Income (Loss) divided by Adjusted Weighted-Average Shares Outstanding for our Class A Common Stock, Class B Common Stock, Class C Common Stock and Class D Common Stock assuming the exchange of all vested and outstanding common units in Alclear at the end of each period presented. We do not present Adjusted Net Income (Loss) per Common Share for shares of our Class B Common Stock although they are participating securities based on the assumed conversion of those shares to our Class A Common Stock. We do not present Adjusted Net Income (Loss) per Common Share on a dilutive basis for periods where we have Adjusted Net Income (Loss) since we do not assume the conversion of any potentially dilutive equity instruments as the result would be antidilutive. In periods where we have Adjusted Net Income, the Company also calculates Adjusted Net Income per Common Share, Diluted based on the effect of potentially dilutive equity instruments for the periods presented using the treasury stock/if-converted method, as applicable. Adjusted Net Income (Loss) and Adjusted Net Income (Loss) per Common Share exclude, to the extent applicable, the tax effected impact of non-cash expenses and other items that are not directly related to our core operations. These items are excluded because they are connected to the Company’s long term growth plan and not intended to increase short term revenue in a specific period. Further, to the extent that other companies use similar methods in calculating non-GAAP measures, the provision of supplemental non-GAAP information can allow for a comparison of the Company’s relative performance against other companies that also report non-GAAP operating results. Free Cash Flow We define Free Cash Flow as net cash provided by (used in) operating activities adjusted for purchases of property and equipment plus the value of share repurchases over fair value. With regards to our CLEAR Plus subscription service, we generally collect cash from our members upfront for annual subscriptions. As a result, when the business is growing Free Cash Flow can be a real time indicator of the current trajectory of the business. See below for reconciliations of these non-GAAP financial measures to their most comparable GAAP measures. Non-GAAP Financial Measures (Cont.)
Clear Secure, Inc. | Q2 2023 | Page 18 Shareholder Letter Q2 2023 This release may contain statements that constitute forward-looking statements within the meaning of the Private Securities Litigation Reform Act of 1995. Investors are cautioned that any and such forward looking statement are not guarantees of future performance or results and involve risks and uncertainties, and that actual results, developments and events may differ materially from those in the forward-looking statements as a result of various factors, including those described in the Company’s filings with the Securities and Exchange Commission, including the sections titled “Risk Factors” in our Annual Report on Form 10-K for the year ended December 31, 2022 and in our Quarterly Report for the fiscal quarter ended June 30, 2023. The Company disclaims any obligation to update any forward looking statements contained herein. Forward-Looking Statements
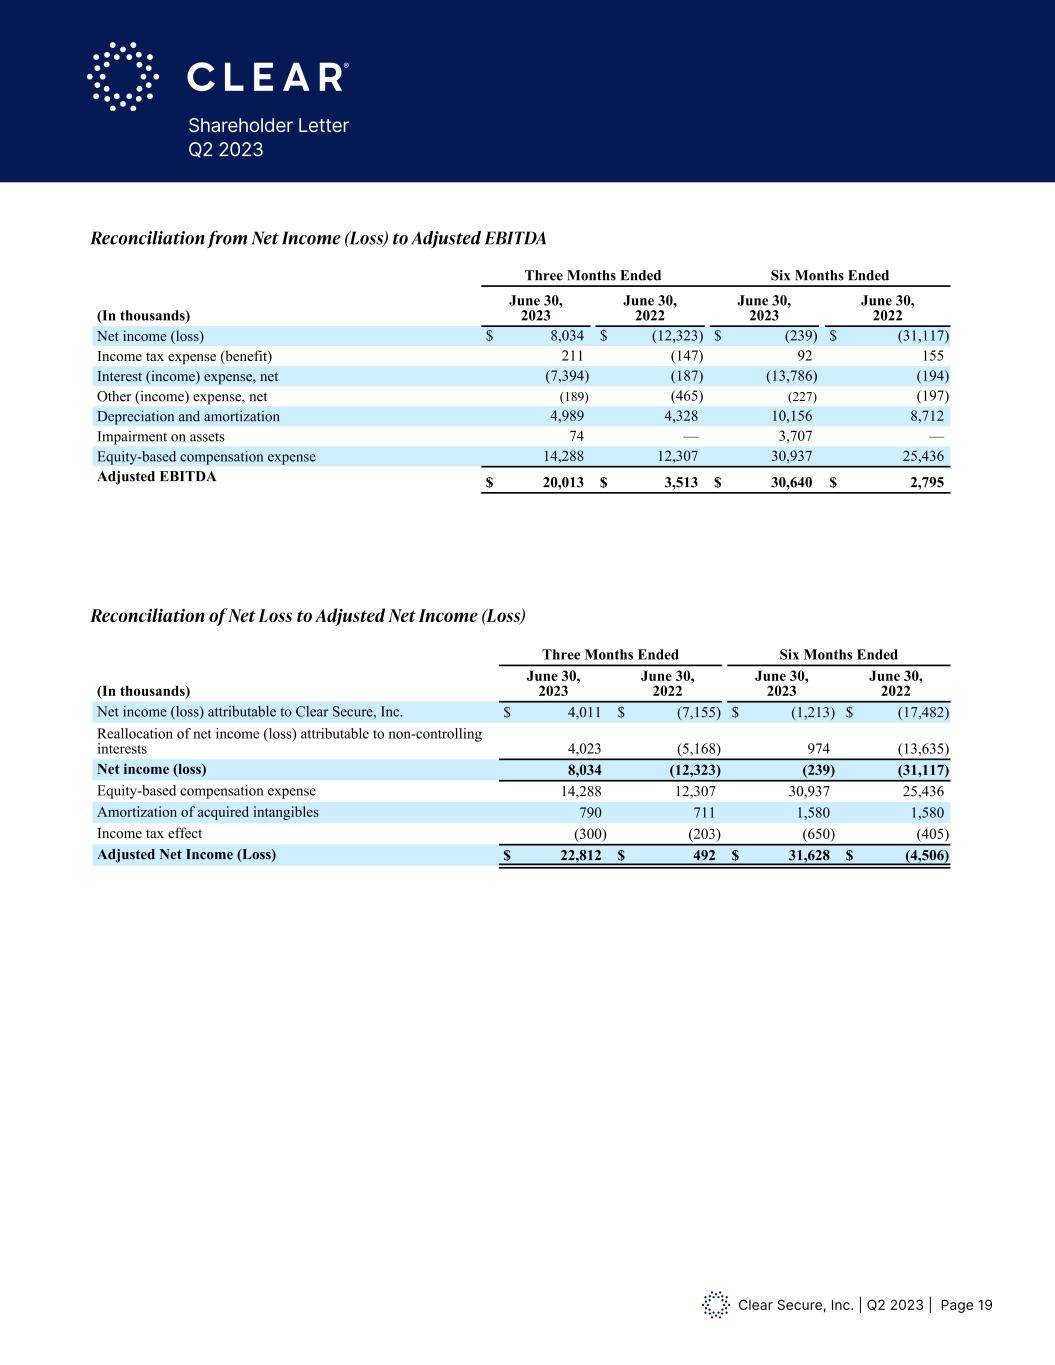
Clear Secure, Inc. | Q2 2023 | Page 19 Shareholder Letter Q2 2023 Forward-Looking Statements This release may contain statements that constitute forward-looking statements within the meaning of the Private Securities Litigation Reform Act of 1995. Investors are cautioned that any and such forward looking statement are not guarantees of future performance or results and involve risks and uncertainties, and that actual results, developments and events may differ materially from those in the forward-looking statements as a result of various factors, including those described in the Company’s filings with the Securities and Exchange Commission, including the sections titled “Risk Factors” in our Annual Report on Form 10-K for the year ended December 31, 2022 and in our Quarterly Report for the fiscal quarter ended June 30, 2023. The Company disclaims any obligation to update any forward looking statements contained herein. Reconciliation of Net Income (Loss) to Adjusted EBITDA: Three Months Ended Six Months Ended (In thousands) June 30, 2023 June 30, 2022 June 30, 2023 June 30, 2022 Net income (loss) $ 8,034 $ (12,323) $ (239) $ (31,117) Income tax expense (benefit) 211 (147) 92 155 Interest (income) expense, net (7,394) (187) (13,786) (194) Other (income) expense, net (189) (465) (227) (197) Depreciation and amortization 4,989 4,328 10,156 8,712 Impairment on assets 74 — 3,707 — Equity-based compensation expense 14,288 12,307 30,937 25,436 Adjusted EBITDA $ 20,013 $ 3,513 $ 30,640 $ 2,795 Reconciliation of Net Income (Loss) to Adjusted Net Income (Loss) Three Months Ended Six Months Ended (In thousands) June 30, 2023 June 30, 2022 June 30, 2023 June 30, 2022 Net income (loss) attributable to Clear Secure, Inc. $ 4,011 $ (7,155) $ (1,213) $ (17,482) Reallocation of net income (loss) attributable to non-controlling interests 4,023 (5,168) 974 (13,635) Net income (loss) 8,034 (12,323) (239) (31,117) Equity-based compensation expense 14,288 12,307 30,937 25,436 Amortization of acquired intangibles 790 711 1,580 1,580 Income tax effect (300) (203) (650) (405) Adjusted Net Income (Loss) $ 22,812 $ 492 $ 31,628 $ (4,506) Calculation of Adjusted Weighted-Average Shares Outstanding Basic and Diluted Three Months Ended June 30, 2023 June 30, 2022 Weighted-average number of shares outstanding, basic for Class A Common Stock 89,569,933 79,420,204 Adjustments Assumed weighted-average conversion of issued and outstanding Class B Common Stock 907,234 1,042,234 Assumed weighted-average conversion of issued and outstanding Class C Common Stock 36,176,257 41,892,237 Assumed weighted-average conversion of issued and outstanding Class D Common Stock 25,796,690 26,705,315 Assumed weighted-average conversion of vested and outstanding warrants — 194,108 Adjusted Weighted-Average Number of Shares Outstanding, Basic 152,450,114 149,254,098 Weighted-average impact of unvested RSAs 32,111 1,213,374 Weighted-average impact of unvested RSUs 770,400 642,547 Total incremental shares 802,511 1,855,921 Adjusted Weighted-Average Number of Shares Outstanding, Diluted 153,252,625 151,110,019 Forward-Looking Statem nts This release may contain statements that constitute forward-looking statements within the meaning of the Private Securities Litigation Reform Act of 1995. Investors are cautioned that any and such forward looking statement are not guarantees of future performance or results and involve risks and uncertainties, and that actual results, developments and events may differ materially from those in the forward-looking statements as a result of various factors, including those described in the Company’s filings with the Securities and Exchange Commission, including the sections titled “Risk Factors” in our Annual Report on Form 10-K for the year ended December 31, 2022 and in our Quarterly Report for the fiscal quarter ended June 30, 2023. The Company disclaims any obligation to update any forward looking statements contained herein. Reconciliation of Net Income (Loss) to Adjusted EBITDA: Three Months Ended Six Months Ended (In thousands) June 30, 2023 June 30, 2022 June 30, 2023 June 30, 2022 Net income (loss) $ 8,034 $ (12,323) $ (239) $ (31,117) Income tax expense (benefit) 211 (147) 92 155 Interest (income) expense, net (7 394) (187) (13 786) (1 4) Other (income) expense, net (189) (465) (227) (197) Depreciation a d amortizati n 4,989 4,328 10,156 8,712 Impairment on assets 74 — 3,707 — Equity-based compensation expense 14,288 12,307 30,937 25,436 Adjusted EBITDA $ 20,013 $ 3,513 $ 30,640 $ 2,795 Reconciliati n of Net Income (Loss) to Adjusted Net Income (Loss) Three Months Ended Six Months Ended (In thousands) June 30, 2023 June 30, 2022 June 30, 2023 June 30, 2022 Net income (loss) attributable to Clear Secure, Inc. $ 4,011 $ (7,155) $ (1,213) $ (17,482) Reallocation of net income (loss) attributable to non-controlling intere ts 4 023 (5,168) 974 (13 635 Net income (loss) 8,034 (12,323) (239) (31,117) Equity-based compensation expense 14,288 12,307 30,937 25,436 Amortization of acquired intangibles 790 711 1,580 1,580 Income tax effect (300) (203) (650) (405) Adjusted Net Income (Loss) $ 22,812 $ 492 $ 31,628 $ (4,506) Calculation of Adjusted Weighted-Average Shares Outstanding Basic and Diluted Three Months Ended June 30, 2023 June 30, 2022 Weighte -average number of share utstanding, basic for Class A Common Stock 89,569,933 79,420 2 4 justments Assume weighted-average co rsion of i sued and outstanding Class B Common Stock 907 234 042 23 Assume weighted-average co rsion of i sued and outstanding Class C Common Stock 36,1 6 257 41,89 23 Assumed weighted-average conversion of issued and outstanding Class D Common Stock 25,796 690 26 70 315 ss m weighted-average conversion of vested and ou standing warrants — 94 108 Adjusted Weighted-Average Number of Shares Outstanding, Basic 152,450,114 149,254,098 Weighted-average impact of unvested RSAs 32,111 1,213,374 Weighted-average impact of unvested RSUs 770,400 642,547 Total incremental shares 802,511 1,855,921 Adjusted Weighted-Average Number of Shares Outstanding, Diluted 153,252,625 151,110,019 Reconciliation from Net Income (Loss) to Adjusted EBITDA Reconciliation of Net Loss to Adjusted Net Income (Loss)
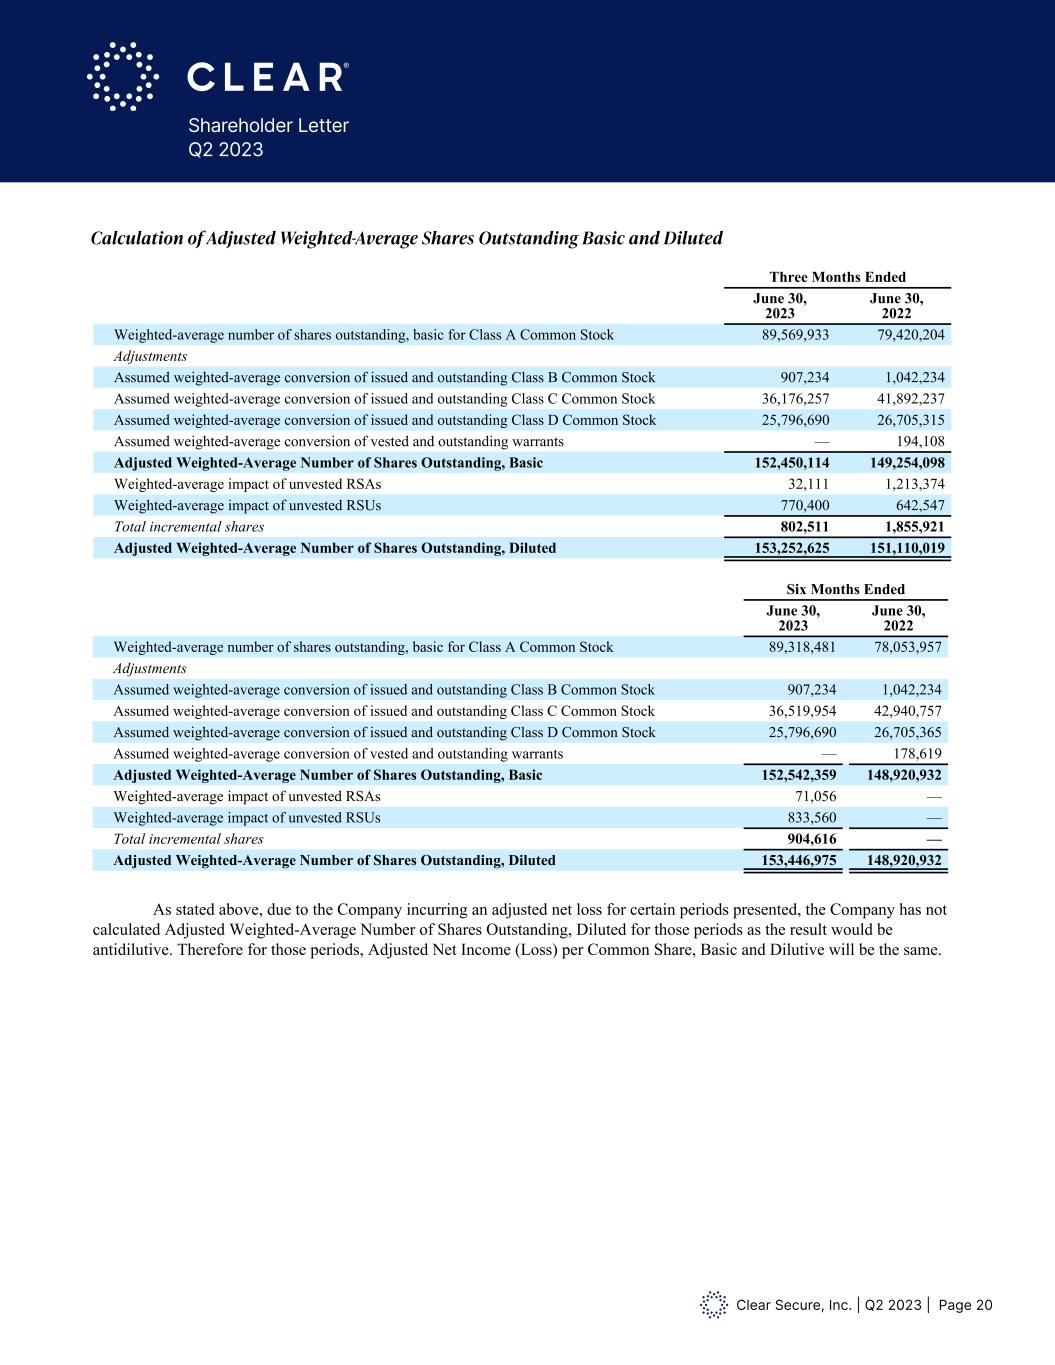
Clear Secure, Inc. | Q2 2023 | Page 20 Shareholder Letter Q2 2023 Calculation of Adjusted Weighted-Average Shares Outstanding Basic and Diluted Three Months Ended June 30, 2023 June 30, 2022 Weighted-average number of shares outstanding, basic for Class A Common Stock 89,569,933 79,420,204 Adjustments Assumed weighted-average conversion of issued and outstanding Class B Common Stock 907,234 1,042,234 Assumed weighted-average conversion of issued and outstanding Class C Common Stock 36,176,257 41,892,237 Assumed weighted-average conversion of issued and outstanding Class D Common Stock 25,796,690 26,705,315 Assumed weighted-average conversion of vested and outstanding warrants — 194,108 Adjusted Weighted-Average Number of Shares Outstanding, Basic 152,450,114 149,254,098 Weighted-average impact of unvested RSAs 32,111 1,213,374 Weighted-average impact of unvested RSUs 770,400 642,547 Total incremental shares 802,511 1,855,921 Adjusted Weighted-Average Number of Shares Outstanding, Diluted 153,252,625 151,110,019 Six Months Ended June 30, 2023 June 30, 2022 Weighted-average number of shares outstanding, basic for Class A Common Stock 89,318,481 78,053,957 Adjustments Assumed weighted-average conversion of issued and outstanding Class B Common Stock 907,234 1,042,234 Assumed weighted-average conversion of issued and outstanding Class C Common Stock 36,519,954 42,940,757 Assumed weighted-average conversion of issued and outstanding Class D Common Stock 25,796,690 26,705,365 Assumed weighted-average conversion of vested and outstanding warrants — 178,619 Adjusted Weighted-Average Number of Shares Outstanding, Basic 152,542,359 148,920,932 Weighted-average impact of unvested RSAs 71,056 — Weighted-average impact of unvested RSUs 833,560 — Total incremental shares 904,616 — Adjusted Weighted-Average Number of Shares Outstanding, Diluted 153,446,975 148,920,932 As stated above, due to the Company incurring an adjusted net loss for certain periods presented, the Company has not calculated Adjusted Weighted-Average Number of Shares Outstanding, Diluted for those periods as the result would be antidilutive. Therefore for those periods, Adjusted Net Income (Loss) per Common Share, Basic and Dilutive will be the same. Calculation of Adjusted Basic Net Income (Loss) Per Common Share, Basic Three Months Ended June 30, 2023 June 30, 2022 Adjusted Net Income in thousands $ 22,812 $ 492 Adjusted Weighted-Average Number of Shares Outstanding, Basic 152,450,114 149,254,098 Adjusted Net Income per Common Share, Basic $ 0.15 $ 0.00 Six Months Ended June 30, 2023 June 30, 2022 Adjusted Net Income (Loss) in thousands $ 31,628 $ (4,506) Adjusted Weighted-Average Number of Shares Outstanding, Basic 152,542,359 149,254,098 Adjusted Net Income (Loss) per Common Share, Basic $ 0.21 $ (0.03) Calculation of Adjusted Net Income (Loss) per Common Share, Diluted Six Months Ended June 30, 2023 June 30, 2022 Weighted-average number of shares outstanding, basic for Class A Common Stock 89,318,481 78,053,957 Adjustments Assumed weighted-average conversion of issued and outstanding Class B Common Stock 907,234 1,042,234 Assumed weighted-average conversion of issued and outstanding Class C Common Stock 36,519,954 42,940,757 Assumed weighted-average conversion of issued and outstanding Class D Common Stock 25,796,690 26,705,365 Assumed weighted-average conversion of vested and outstanding warrants — 178,619 Adjusted Weighted-Average Number of Shares Outstanding, Basic 152,542,359 148,920,932 Weighted-average impact of unvested RSAs 71,056 — Weighted-average impact of unvested RSUs 833,560 — Total incremental shares 904,616 — Adjusted Weighted-Average Number of Shares Outstanding, Diluted 153,446,975 148,920,932 As stated above, due to the Company incurring an adjusted net loss for certain periods presented, the Company has not calculated Adjusted Weighted-Average Number of Shares Outstanding, Diluted for those periods as the result would be antidilutive. Therefore for those periods, Adjusted Net Income (Loss) per Common Share, Basic and Dilutive will be the same. Calculation of Adjusted Basic Net Income (Loss) Per Common Share, Basic Three Months Ended June 30, 2023 June 30, 2022 Adjusted Net Income in thousands $ 22,812 $ 492 Adjusted Weighted-Average Number of Shares Outstanding, Basic 152,450,114 149,254,098 Adjusted Net Income per Common Share, Basic $ 0.15 $ 0.00 Six Months Ended June 30, 2023 June 30, 2022 Adjusted Net Income (Loss) in thousands $ 31,628 $ (4,506) Adjusted Weighted-Average Number of Shares Outstanding, Basic 152,542,359 149,254,098 Adjusted Net Income (Loss) per Common Share, Basic $ 0.21 $ (0.03) Calculation of Adjusted Net Income (Loss) per Common Share, Diluted Three Months Ended June 30, 2023 June 30, 2022 Adjusted Net Income in thousands $ 22,812 $ 492 Adjusted Weighted-Average Number of Shares Outstanding, Diluted 153,252,625 151,110,019 Adjusted Net Income per Common Share, Diluted: $ 0.15 $ 0.00 Six Months Ended June 30, 2023 Adjusted Net Income in thousands $ 31,628 Adjusted Weighted-Average Number of Shares Outstanding, Diluted 153,446,975 Adjusted Net Income per Common Share, Diluted: $ 0.21 Summary of Adjusted Net Income (Loss) per Common Share: Three Months Ended Six Months Ended June 30, 2023 June 30, 2022 June 30, 2023 June 30, 2022 Adjusted Net Income (Loss) per Common Share, Basic $ 0.15 $ 0.00 $ 0.21 $ (0.03) Adjusted Net Income (Loss) per Common Share, Diluted $ 0.15 $ 0.00 $ 0.21 $ (0.03) Calculation of Adjusted Weighted-Average Shares Outstanding Basic and Diluted
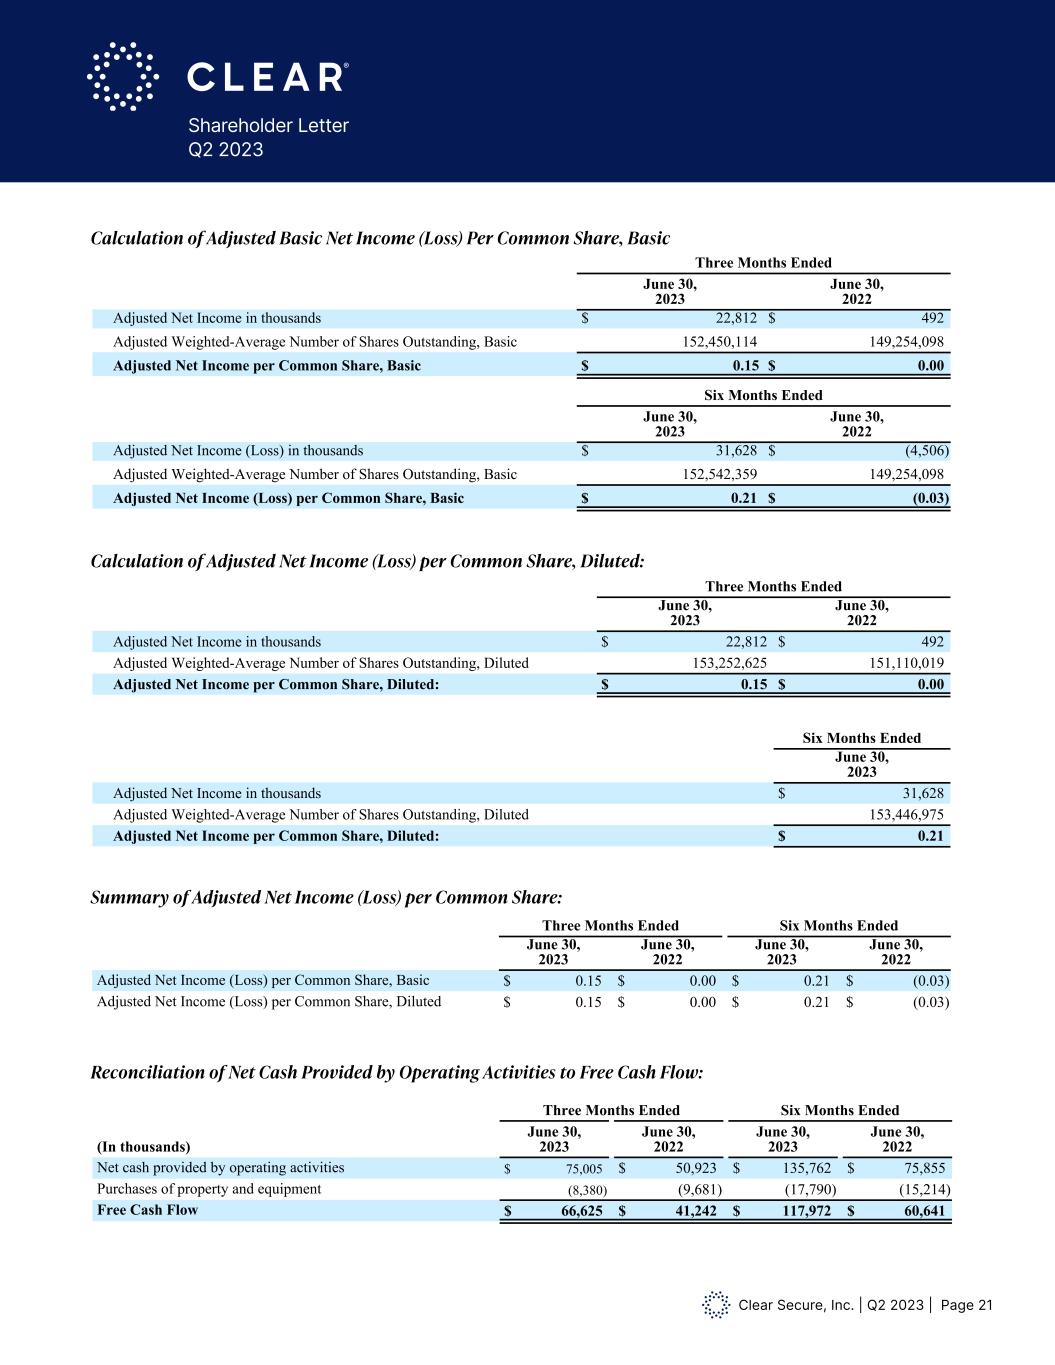
Clear Secure, Inc. | Q2 2023 | Page 21 Shareholder Letter Q2 2023 Six Months Ended June 30, 2023 June 30, 2022 Weighted-average number of shares outstanding, basic for Class A Common Stock 89,318,481 78,053,957 Adjustments Assumed weighted-average conversion of issued and outstanding Class B Common Stock 907,234 1,042,234 Assumed weighted-average conversion of issued and outstanding Class C Common Stock 36,519,954 42,940,757 Assumed weighted-average conversion of issued and outstanding Class D Common Stock 25,796,690 26,705,365 Assumed weighted-average conversion of vested and outstanding warrants — 178,619 Adjusted Weighted-Average Number of Shares Outstanding, Basic 152,542,359 148,920,932 Weighted-average impact of unvested RSAs 71,056 — Weighted-average impact of unvested RSUs 833,560 — Total incremental shares 904,616 — Adjusted Weighted-Average Number of Shares Outstanding, Diluted 153,446,975 148,920,932 As stated above, due to the Company incurring an adjusted net loss for certain periods presented, the Company has not calculated Adjusted Weighted-Average Number of Shares Outstanding, Diluted for those periods as the result would be antidilutive. Therefore for those periods, Adjusted Net Income (Loss) per Common Share, Basic and Dilutive will be the same. Calculation of Adjusted Basic Net Income (Loss) Per Common Share, Basic Three Months Ended June 30, 2023 June 30, 2022 Adjusted Net Income in thousands 22,812 492 Adjusted Weighted-Average Number of Shares Outstanding, Basic 152,450,114 149,254,098 Adjusted Net Income per Common Share, Basic $0.15 $ 0.00 Six Months Ended June 30, 2023 June 30, 2022 Adjusted Net Income (Loss) in thousands 31,628 (4,506) Adjusted Weighted-Average Number of Shares Outstanding, Basic 152,542,359 149,254,098 Adjusted Net Income (Loss) per Common Share, Basic $ 0.21 $ (0.03) Calculation of Adjusted Net Income (Loss) per Common Share, Diluted Three Months Ended June 30, 2023 June 30, 2022 Adjusted Net Income in thousands $ 22,812 $ 492 Adjusted Weighted-Average Number of Shares Outstanding, Diluted 153,252,625 151,110,019 Adjusted Net Income per Common Share, Diluted: $ 0.15 $ 0.00 Six Months Ended June 30, 2023 Adjusted Net Income in thousands $ 31,628 Adjusted Weighted-Average Number of Shares Outstanding, Diluted 153,446,975 Adjusted Net Income per Common Share, Diluted: $ 0.21 Summary of Adjusted Net Income (Loss) per Common Share: Three Months Ended Six Months Ended June 30, 2023 June 30, 2022 June 30, 2023 June 30, 2022 Adjusted Net Income (Loss) per Common Share, Basic $ 0.21 $ 0.00 $ 0.21 $ (0.03) Adjusted Net Income (Loss) per Common Share, Diluted $ 0.15 $ 0.00 $ 0.21 $ (0.03) Three Months Ended June 0, 2023 June 30, 2022 Adjusted Net Income in thousands $ 22,812 $ 492 Adjusted Weighted-Average Number of Shares Outstanding, Diluted 153,252,625 151,110,019 Adjusted Net Income per Common Share, Diluted: $ 0.15 $ 0.00 Six Months Ended June 0, 2023 Adjusted Net Income in thousands $ 31,628 Adjusted Weighted-Average Number of Shares Outstanding, Diluted 153,446,975 Adjusted Net Income per Common Share, Diluted: $ 0.21 Summary of Adjusted Net Income (Loss) per Common Share: Three Months Ended Six Months Ended June 0, 2023 June 30, 2022 June 0, 2023 June 30, 2022 Adjusted Net Income (Loss) per Common Share, Basic $ 0.15 $ 0.00 $ 0.21 $ (0.03) Adjusted Net Income (Loss) per Common Share, Diluted $ 0.15 $ 0.00 $ 0.21 $ (0.03) lation of Adjusted Net Income (Loss) per C mmon Share, Diluted: ary of Adjusted Net Income (Loss) per C mmon Share: Calculation of Adjusted Basic Net Income (Loss) Per Common Share, Basic Six Months Ended June 30, 2023 June 30, 2022 Weighted-average number of shares outstanding, basic for Class A Common Stock 89,318,481 78,053,957 Adjustments ssumed weighted-average conversion of issued and outstanding Class B Common Stock 907,234 1,042,234 ssu ed eighted-average conversion of issued and outstanding lass C o on tock 36,519,954 42,940,757 ssu ed eighted-average conversion of issued and outstanding lass D o on tock 25,796,690 26,705,365 ssu ed eighted-average conversion of vested and outstanding warrants — 178,619 dj ste Weighted-Average Number of Shares Outstanding, Basic 152,542,359 148,920,932 Weighted-average impact of unvested RSAs 71,056 — eighted-average i pact of unvested Us 833,560 Total incremental shares 904,616 Adjusted Weighted-Average Number of Shares Outstanding, Diluted 153,446,975 148,920,932 As stated above, due to the Company incurring an adjusted net loss for certain periods presented, the Company has not calculated Adjusted Weighted-Average Number of Shares Outstan i g, Diluted fo those periods a the result w uld be antidilutive. Ther fore for those p iods, Adjusted Net Income (Loss) per Common Shar , Basic and Dilutive ill be the same. lation of Adjusted Basic Net Income (Loss) Per Comm n Share, Basic Three Months Ended June 30, 2023 June 30, 2022 Adjusted Net Income in thousands 22,812 492 Adjusted Weighted-Average Number of Shares Outstanding, Basic 152,450,114 149,254,098 Adjusted Net Income per Common Share, Basic $0.15 $ 0.00 Six Months Ended June 30, 2023 June 30, 2022 Adjusted Net Income (Loss) in thousands 31,628 (4,506) Adjusted Weighted-Average Number of Shares Outstanding, Basic 152,542,359 149,254,098 Adjusted Net Income (Loss) per Common Share, Basic $ 0.21 $ (0.03) Calculation of Adjusted Net Income (Loss) per Common Share, Diluted Three Months Ended June 30, 2023 June 30, 2022 Adjusted Net Income in thousands $ 22,812 $ 492 djusted Weighted-Average Number of Shares Outstanding, Diluted 153,252,625 151,110,019 j sted Net Income per Com on Share, Diluted: $ 0.15 $ 0.00 Six Months Ended June 30, 2023 Adjusted Net Income in thousands $ 31,628 djusted Weighted-Average Number of Shares Outstanding, Diluted 153,446,975 j sted Net Income per Com on Share, Diluted: $ 0.21 Summary of Adjusted Net Income (Loss) per Common Share: Three Months Ended Six Months Ended June 30, 2023 Jun 30, 2022 June 30, 2023 June 30, 2022 Adjusted Net Income (Loss) per Common Share, Basic $ 0.21 $ 0.00 $ 0.21 $ (0.03) djusted et Inco e ( oss) per o on hare, Diluted $ 0.15 $ 0.00 $ 0.21 $ (0.03) Six Months Ended June 30, 2023 June 30, 2022 Weighted-average number of shares outsta ding, basic for Class A Common Stock 89,318,481 78,053, 57 Adjustments Assumed weighted-average conversion of issu d and utstanding Class B Common Stock 907,234 1,042,234 Assumed weighted-average conversion of issu d and utstanding Class C Common Stock 36,519,954 42,940,757 Assumed weighted-average conversion of issu d and utstanding Class D Common Stock 25,796,690 26,705,365 Assumed weighted-average conversion of vested and outstanding warrants — 178,619 Adjusted Weighted-Average Number of Shar s Outstandi g, Basic 152,542,359 148,920,932 Weighted-average impact of unvested RSAs 71,056 — Weighted-average impact of unvested RSUs 833,560 — Total incremental shares 904,616 — Adjusted Weighted-Average Number of Shar s Outstanding, Diluted 153,446,975 148,920,932 As stated above, due to the Company incurring an adjusted net loss for certain periods present d, the Company has not calculated Adjusted Weighted- ver ge Number of Shar s Outst ding, Dilut d for those p riods as the esult would be antidilutive. Therefore for those periods, Adjusted N t Inc me (Los ) per Common Share, Basic and Dilu ive will be the same. Calculation of Adjusted Basic Net Income (Loss) Per Common Share, Basic Three Months Ended June 30, 2023 June 30, 2022 Adjusted Net Income in tho ands 22,812 492 Adjusted Weighted-Average Number of Shares Outstanding, Basic 152,450,114 149,254,098 Adjusted Net Income per Common Share, Basic $0.15 $ 0.00 Six Months Ended June 30, 2023 June 30, 2022 Adjusted Net Income (Loss) in thousands 31,628 (4,506) Adjusted Weighted-Average Number of Shares Outstanding, Basic 152,542,359 149,254,098 Adjusted Net Income (Loss) per Comm n Share, Basic $ 0.21 $ (0.03) Calculation of Adjusted Net Income (Los ) per Common Share, Diluted Three Months Ended June 30, 2023 June 30, 2022 Adjusted Net Income in tho ands $ 22,812 $ 492 Adjusted Weighted-Average Number of Shares Outstanding, Diluted 153,252,625 151,110,019 Adjusted Net Income per Common S are, Diluted: $ 0.15 $ 0.00 Six Months Ended June 30, 2023 Adjusted Net Income in tho ands $ 31,628 Adjusted Weighted-Average Number of Shares Outstanding, Diluted 153,446,975 Adjusted Net Income per Common S are, Diluted: $ 0.21 Summary of Adjusted Net Income (Los ) per Common Share: Three Months Ended Six Months Ended June 30, 2023 June 30, 2022 June 30, 2023 June 30, 2022 Adjusted Net Income (Loss) p r Common Share, Basic $ 0.21 $ 0.00 $ 0.21 $ (0.03) Adjusted Net Income (Loss) p r Common Share, Diluted $ 0.15 $ 0.00 $ 0.21 $ (0.03) Six Months En ed June 30, 023 June 30, 022 Weight d-aver ge umber o shares outsta ding, basi for Class A Common Stock 89,31 ,481 78,053,957 Adjustments Assumed weighted-average conversi n of issued and outsta ding Class B Common Stock 907,234 1,042,234 Assumed weighted-average conversi n of issued and outsta ding Class C Common Stock 36,519,954 42,940, 57 Assumed weighted-average conversi n of issued and outsta ding Class D Common Stock 25,796,690 26,705,365 Assumed weight d-average conversi n of v sted and outsta ding w rrants — 178,619 Adjusted Weighted-Average Number of Shares Outstanding, Basic 1 2,542,359 148,920,932 Weighted-average impact of unv sted R As 71,056 — Weighted-average impact of unv sted RSUs 833,560 — Total incr mental shares 904, 16 — Adjusted Weighted-Average Number of Shares Outstanding, Diluted 153,446,975 148,920,932 As stated bove, due o the Company incurring an djusted net loss for certain periods pre ented, the Company has not alculated Adjusted Weighted-Average Number of Sh res Outstanding, Diluted for those period as th result would be an idilutive. Therefore for those periods, Adjusted Net Income (Loss) per Co mon Shar , Ba ic and Dil tive will the same. Calculation of Adjust asic Net Income (Loss) Per Co mon Share, Basic Three Months En ed June 30, 023 June 30, 022 Adjusted Net Income in thousands 22,812 492 Adjusted Weig ted-Average Number of Shares Outsta ding, Basic 152,450 11 149,254,098 Adjusted Net Incom per Common Share, Basic $0.15 $ .00 Six Months En ed June 30, 023 June 30, 022 Adjusted Net Income (Loss) in thousands 31,628 (4,506) Adjusted Weig ted-Average Number of Shares Outsta ding, Basic 1 2,5 2 3 9 149,254,098 Adjusted Net Income (Loss) per Common Share, Basic $ 0.21 $ (0.03) Calculation of Adjust d Net Income (Loss) per Co mon Share, Diluted Three Months En ed June 30, 0 3 June 30, 022 Adjusted Net Income in thousands $ 22,812 $ 492 Adjusted Weig ted-Average Number of Shares Outsta ding, Diluted 153, 5 ,625 5 ,110,019 Adjusted Net Incom per Common are, Diluted: $ 0.15 $ .00 Six Months En ed June 30, 023 Adjusted Net Income in thousands $ 31,628 Adjusted Weig ted-Average Number of Shares Outsta ding, Diluted 153,446,975 Adjusted Net Incom per Common are, Diluted: $ 0.21 Su mary of Adjust d Net Income (Loss) per Co mon Share: Three Months En ed Six Months En ed Jun 30, 023 June 30, 022 June 30, 023 June 30, 022 Adjusted Net Incom (Lo s) per Common Share, Basic $ 0.21 $ .00 $ 0.21 $ (0.03) Adjusted Net Incom (Loss) per Common Share, Diluted $ 0.15 $ .00 $ 0.21 $ (0.03) Six Months Ended June 30, 2023 June 30, 2022 Weighted-average number of shares outstanding, basic for Class A Common Stock 89,318,481 78,053,957 Adjustments Assumed weighted-average conversion of issued and outstanding Class B Common Stock 907,234 1,042,234 Assumed weighted-average conversion of issued and outstanding Class C Common Stock 36,519,954 42,940,757 Assumed weighted-average conversion of issued and outstanding Class D Common Stock 25,796,690 26,705,365 Assumed weighted-average conversion of vested and outstanding warrants — 178,619 Adjusted Weighted-Average Number of Shares Outstanding, Basic 152,542,359 148,920,932 Weighted-average impact of unvested RSAs 71,056 — Weighted-average impact of unvested RSU 33,560 — Total incremental shares 904,616 — Adju ted W ight d-Average Number f Share Outstandi g, Diluted 153,446,9 5 148,920,932 As stated above, due to the Company incurring an adjusted net loss for certain periods presented, the Company has not calculated Adjusted Weighted-Average Number of Shares Outstanding, Diluted for those periods as the result would be antidilutive. Therefore for those periods, Adjusted Net Income (Loss) per Common Share, Basic and Dilutive will be the same. Calculation of Adjusted Basic Net Income (Loss) Per Common Share, Basic Three Months Ended June 30, 2023 June 30, 2022 Adjusted Net Income in thousands 22,812 492 Adjusted Weighted-Average Number of Shares Outstanding, Basic 152,450,114 149,254,098 Adj sted Net Income pe C mm n Share, Basic $0.15 $ 0.00 Six Months Ended June 30, 2023 June 30, 2022 Adjusted Net Income (Loss) in thousands 31,628 (4,506) Adjusted Weighted-Average Number of Shares Outstanding, Basic 152,542,359 149,254,098 Adjusted Net Income (Loss) per Common Share, Basic $ 0.21 $ (0.03) Calculation of Adjusted Net Income (Loss) per Common Share, Diluted Three June 30, 2023 June 30, 20 2 Adju te Net Income in thou ands $ 22,81 $ 492 djuste Weighted-Average Number of Shares Outstandi g, Diluted 153, ,62 151,110,019 Adjusted Net Income per Common Share, Diluted: $ 0.1 $ 0.00 Six Months Ended June 30, 2023 Adjusted Net Income in thousands $ 31,628 Adjuste Weighted-Av rage N mber of Shares Outstanding, Diluted 153,446,975 djust Net Income p r Common Share, Diluted: $ 0.21 Summary of Adjusted Net Income (Loss) per Common Share: Three Months Ended Six Months E ded June 30, 2023 June 30, 2022 June 30, 2023 June 30, 022 Adjuste Net Incom (Loss) per Common Share, Basic $ 0.21 $ 0.00 $ 0.21 $ (0.03) Adjuste Net Income (Loss) per Com on Share, Diluted $ 0.15 $ 0.00 $ 0.21 $ (0.03) Six Months Ended June 30, 2023 June 30, 2022 Weighted-average number of shares outstanding, basic for Class A Common Stock 89,318,481 78,053,957 Adjustments Assumed weighted-average conversion of issued and outstanding Class B Common Stock 907,234 1,042,234 Assumed weighted-average conversion of issued and outstanding Class C Common Stock 36,519,954 42,940,757 Assumed weighted-average conversion of issued and outstanding Class D Common Stock 25,796,690 26,705,365 Assumed weighted-average conversion of vested and outstanding warrants — 178,619 Adjusted Weighted-Average Number of Shares Outstanding, Basic 152,542,359 148,920,932 Weighted-average impact of unvested RSAs 71,056 — Weighted-average impact of unvested RSUs 833,560 — Total incremental shares 904,616 — Adjusted Weighted-Average Number of Shares Outstanding, Diluted 153,446,975 148,920,932 As stated above, due to the Company incurring an adjusted net loss for certain periods presented, the Company has not calculated Adjusted Weighted-Average Number of Shares Outstanding, Diluted for those periods as the result would be a tidilutive. Th r for for thos periods, Adjusted Net In ome (Loss) per C mmon Share, Basic and Dilutive will be the same. Calculation of Adjusted B sic et I c me (Lo ) Per C mm n Share, Basic Three Months Ended June 30, 2023 June 30, 2 22 Adjusted Net Income in thousands 22,812 492 Adjusted Weighted-Averag Number of Shares Outstanding, Basic 152,450,114 149,254,098 Adjusted N t Income per C mmon Share, Basic $0.15 $ 0.00 Six Months Ended (Loss) in thousands 31 628 (4,506) 542 359 (Lo s) per Common Share, Basic $ .21 ( 3) Calcu tion f Adjusted Net Incom (Loss) per Common Share, Diluted Three Months Ended June 30, 2023 June 30, 20 2 Adjuste Net Income in thousands $ 2 ,81 $ 492 djuste Weighted-Average Number of Shares Outstandi g, Diluted 153, ,625 151,110,019 Adjusted Net Income per Common Share, Diluted: $ . 5 $ 0.00 Six Months Ended June 30, 20 3 A j sted Net Income in thou ands $ 31,628 j sted Weighted-Average Nu ber of Shares Outstandi g, Diluted 153, 46,975 Adjusted Net Income per Common Share, Diluted: $ 0.21 Summary of Adjusted N t Income (Loss) per Comm n Share: Three Months Ended Six Months Ended June 30, 2023 June 30, 2022 June 30, 2023 June 30, 022 Adjuste Net Income (Loss) per Common Share, Basic $ 0.21 $ 0.00 $ 0.21 $ (0.03) Adjuste Net Income (Loss) per Com on Share, Diluted $ 0.15 $ 0.00 $ 0.21 $ (0. 3) Six Months Ended June 30, 2023 June 30, 20 2 Weighted-average number of shares ou standing, basic for Class A Co mon Stock 89,318,481 78,053,957 Adjustments Assumed weighted-average conversion of issued and ou standing Class B Co mon Stock 907,234 1,04 ,234 Assumed weighted-average conversion of issued and ou standing Class C Co mon Stock 36,51 ,954 42,940,757 Assumed weighted-average conversion of issued and ou standing Class D Co mon Stock 25,79 ,690 26,705,365 Assumed weighted-average conversion of vested and ou standing warrants — 178,619 Adjusted Weighted-Average Number of Shares Ou standing, Basic 152,542,359 148,920,932 Weighted-average impac of un sted RSAs 71, 56 — W ighted-aver g impact f unv st RSUs 8 3,560 — Total incr tal shares 04,616 — Adjusted Weight -Average N mb of Sh r s Ou standi g, Diluted 153, 46, 75 148,920,93 A stated above, due to the Company incurring an adjusted net loss for certain periods presented, the Company has not calculated Adjusted Weighted-Average Number of Shares Ou standing, Diluted for those periods as the result would be antidilutive. Theref re for those periods, Adjusted Net Income (Loss) per Co mon Share, Basic and Dilutive will be the same. Calculation of Adjusted Basic Net Income (Loss) Per Co mon Share, Basic Three Months Ended June 30, 2023 June 30, 20 2 Adjusted Net Income in thousands 2,812 492 Adjusted Weighted-Average Number of Shares Ou standing, Basic 152, 50, 14 149,254,098 Adjust N t Income p r Co m Share, Ba ic $0.15 $ . 0 Six Months Ended June 30, 2023 June 30, 20 2 Adjusted Net Income (Loss) in thousands 31,628 (4,506) Adjusted Weighted-Average Number of Shares Ou standing, Basic 152,542,359 149,254,098 Adjusted Net Income (Loss) per Co mon Share, Basic $ 0.21 $ ( .03) Calculation of Adjusted Net Income (Loss) per Co mon Share, Diluted Three Months Ended June 30, 2023 June 30, 20 2 Adjusted N t Income in thousa ds $ 2 8 2 $ 92 Adjusted Weighted-Average Number of Shares Ou standing, Diluted 3,25 ,6 5 15 , ,01 Adjusted Net Income p Co mon Share, Dil ted: $ 0.15 $ . 0 Six Months Ended June 30, 2023 Adjusted Net Income in thousands $ 31,628 Adjusted Weighted-Average Number of Shares Ou standing, Diluted 153, 46,975 Adjusted Net Inco p Co mo Share, Diluted: $ .2 Su mary of Adjusted Net Income (Loss) per Co mon Share: Three Months Ended Six Months Ended June 30, 2023 June 30, 20 2 June 30, 2023 June 30, 20 2 Adjusted Net Income (L ss) per Co mon Share, Basic $ 0.21 $ . 0 $ 0.21 $ ( .03) djusted et Income (Los ) p Common Shar , Diluted $ 0.15 $ . 0 $ 0.21 $ ( .03) Six Months Ended June 30, 2023 June 30, 20 2 Weighted-average number of shares ou standing, basic for Class A Co mon Stock 89,318,481 78,053,957 Adjustments Assumed weighted-average conversion of issued and ou standing Class B Co mon Stock 907,234 1,04 ,234 Assumed weighted-average conversion of issued and ou standing Class C Co mon Stock 36,51 ,954 42,940,757 Assumed weighted-average conversion of issued and ou standing Class D Co mon Stock 25,79 ,690 26,705,365 Assumed weighted-average conversion of vested and ou standing warrants — 178,619 Adjusted Weighted-Average Number of Shares Ou standing, Basic 152,542,359 148,920,932 Weighted-average impact of unvested RSAs 71,056 — Weighted-average impact of unvested RSUs 8 3,560 — Total incremental shares 904,616 — Adjusted Weighted-Average Number of Shares Ou standing, Diluted 153, 46,975 148,920,932 A stated abo , due to the C mp ny incurring an adjusted net loss for certain periods presented, the Company has not calculate Adjust d Weighted-Av rage Number of Shares Ou standing, Diluted for those periods as the result would be antidilu ive. Ther fore for tho p riod , djusted Net Inc me (Loss) per Co mon Share, Basic and Dilutive will be the same. Calculati of Adjus B sic et I come (Lo s) Per Co mo Share, Basic Three Months Ended June 30, 2023 June 30, 20 2 Adjusted Net Income in thousands 2,812 492 Adjusted Weighted-Average Number of Shares Ou standing, Basic 152,450, 14 149,254,0 8 Adjust d N t Incom er Co mon Share, Basic $0.15 $ . 0 Six (Loss) i thousands 31 6 8 ( ,506) 42 359 (Loss) per Co n Share, Basic $ .21 ( 3) Calcul t on of Adjust d Net Income (Loss) per C mon Share, Diluted June 30, 2023 June 30, 20 2 Adjusted N t Income in thousand $ $ 492 Adjusted Weighted-Average Number of Shares Ou standing, Diluted 3,2 2,625 15 , 1 ,01 Adjusted Net Income p Co mon Share, Diluted: $ 0. 5 $ . 0 Six Months Ended June 3 , 2023 j ste Net Income in thousa ds $ 31,628 j sted Weighted-Average Nu ber of Shares Ou standing, Diluted 153, 46,975 Adjusted Net Income per Co mon Share, Diluted: $ 0.21 Su mary f Adjusted Net Income (L ss) per Co mon Share: Three Months Ended Six Months Ended June 30, 2023 June 30, 20 2 June 30, 2023 June 30, 2 Adjusted Net Income (Loss) per Co mon Share, Basic $ 0.21 $ . 0 $ 0.21 $ ( .03) Adjusted Net Income (Loss) per Common Share, Diluted $ 0.15 $ . 0 $ 0.21 $ ( . 3) Reconciliation of Net Cash Provided by Operating Activities to Free Cash Flow: Three Months Ended Six Months Ended (In thousands) June 30, 2023 June 30, 2022 June 30, 2023 June 30, 2022 Net cash provided by operating activities $ 75,005 $ 50,923 $ 135,762 $ 75,855 Purchases of property and equipment (8,380) (9,681) (17,790) (15,214) Free Cash Flow $ 66,625 $ 41,242 $ 117,972 $ 60,641 Summary of the components of the Company’s total equity-based compensation expense: Three Months Ended June 30, 2023 (in thousands) Pre-IPO employee performance awards Warrants Founder PSU Employee equity-based awards Total Cost of direct salaries and benefits $ 34 $ — $ — $ 109 $ 143 Research and development 573 — — 4,872 5,445 Sales and marketing 11 — — 121 132 General and administrative (458) — 6,557 2,469 8,568 Total equity-based compensation $ 160 $ — $ 6,557 $ 7,571 $ 14,288 Three Months Ended June 30, 2022 (in thousands) Pre-IPO employee performance awards Warrants Founder PSU Employee equity-based awards Total Cost of direct salaries and benefits $ — $ — $ — $ 43 $ 43 Research and development — — — 2,691 2,691 Sales and marketing — — — 99 99 General and administrative — 51 6,558 2,864 9,473 Total equity-based compensation $ — $ 51 $ 6,558 $ 5,697 $ 12,306 Six Months Ended June 30, 2023 (in thousands) Pre-IPO employee performance awards Warrants Founder PSU Employee equity-based awards Total Cost of direct salaries and benefits $ 57 $ — $ — $ 159 $ 216 Research and development 794 — — 9,602 10,396 Sales and marketing (134) — — 165 31 General and administrative 303 623 13,042 6,325 20,293 Total equity-based compensation $ 1,020 $ 623 $ 13,042 $ 16,251 $ 30,936 Reconciliation of Net Cash Provided by Operating Activities to Free Cash Flow:
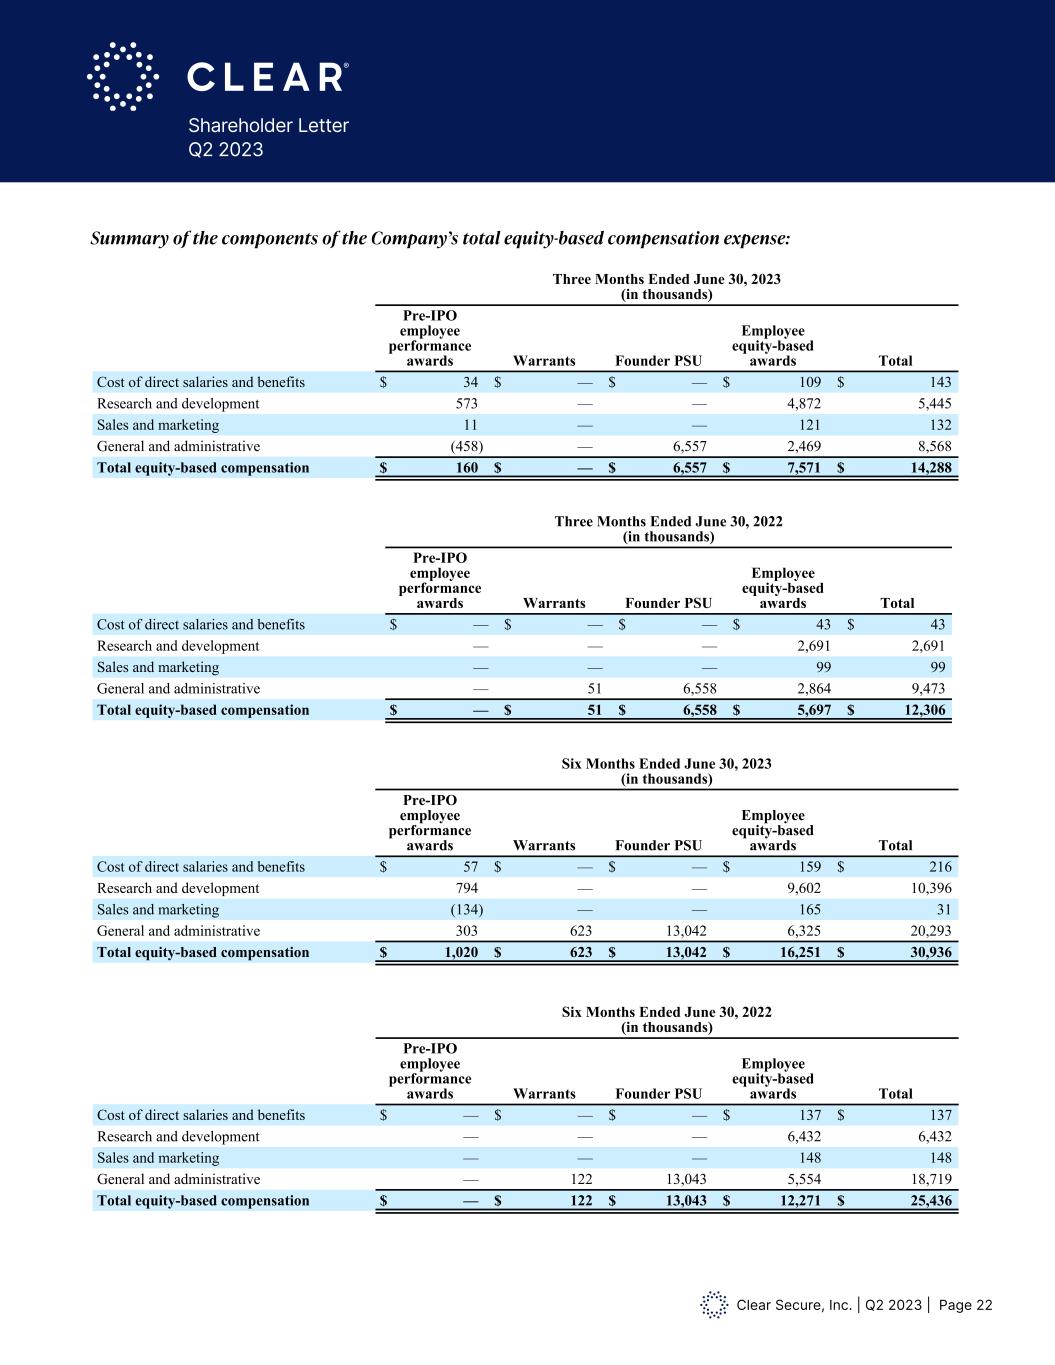
Clear Secure, Inc. | Q2 2023 | Page 22 Shareholder Letter Q2 2023 Summary of the components of the Company’s total equity-based compensation expense: Reconciliation of Net Cash Provided by Operating Activities to Free Cash Flow: Three Months Ended Six Months Ended (In thousands) June 30, 2023 June 30, 2022 June 30, 2023 June 30, 2022 Net cash provided by operating activities $ 75,005 $ 50,923 $ 135,762 $ 75,855 Purchases of property and equipment (8,380) (9,681) (17,790) (15,214) Free Cash Flow $ 66,625 $ 41,242 $ 117,972 $ 60,641 Summary of the components of the Company’s total equity-based compensation expense: Three Months Ended June 30, 2023 (in thousands) Pre-IPO employee performance awards Warrants Founder PSU Employee equity-based awards Total Cost of direct salaries and benefits $ 34 $ — $ — $ 109 $ 143 Research and development 573 — — 4,872 5,445 Sales and marketing 11 — — 121 132 General and administrative (458) — 6,557 2,469 8,568 Total equity-based compensation $ 160 $ — $ 6,557 $ 7,571 $ 14,288 Three Months Ended June 30, 2022 (in thousands) Pre-IPO employee performance awards Warrants Founder PSU Employee equity-based awards Total Cost of direct salaries and benefits $ — $ — $ — $ 43 $ 43 Research and development — — — 2,691 2,691 Sales and marketing — — — 99 99 General and administrative — 51 6,558 2,864 9,473 Total equity-based compensation $ — $ 51 $ 6,558 $ 5,697 $ 12,306 Six Months Ended June 30, 2023 (in thousands) Pre-IPO employee performance awards Warrants Founder PSU Employee equity-based awards Total Cost of direct salaries and benefits $ 57 $ — $ — $ 159 $ 216 Research and development 794 — — 9,602 10,396 Sales and marketing (134) — — 165 31 General and administrative 303 623 13,042 6,325 20,293 Total equity-based compensation $ 1,020 $ 623 $ 13,042 $ 16,251 $ 30,936 Six Months Ended June 30, 2022 (in thousands) Pre-IPO employee performance awards Warrants Founder PSU Employee equity-based awards Total Cost of direct salaries and benefits $ — $ — $ — $ 137 $ 137 Research and development — — — 6,432 6,432 Sales and marketing — — — 148 148 General and administrative — 122 13,043 5,554 18,719 Total equity-based compensation $ — $ 122 $ 13,043 $ 12,271 $ 25,436
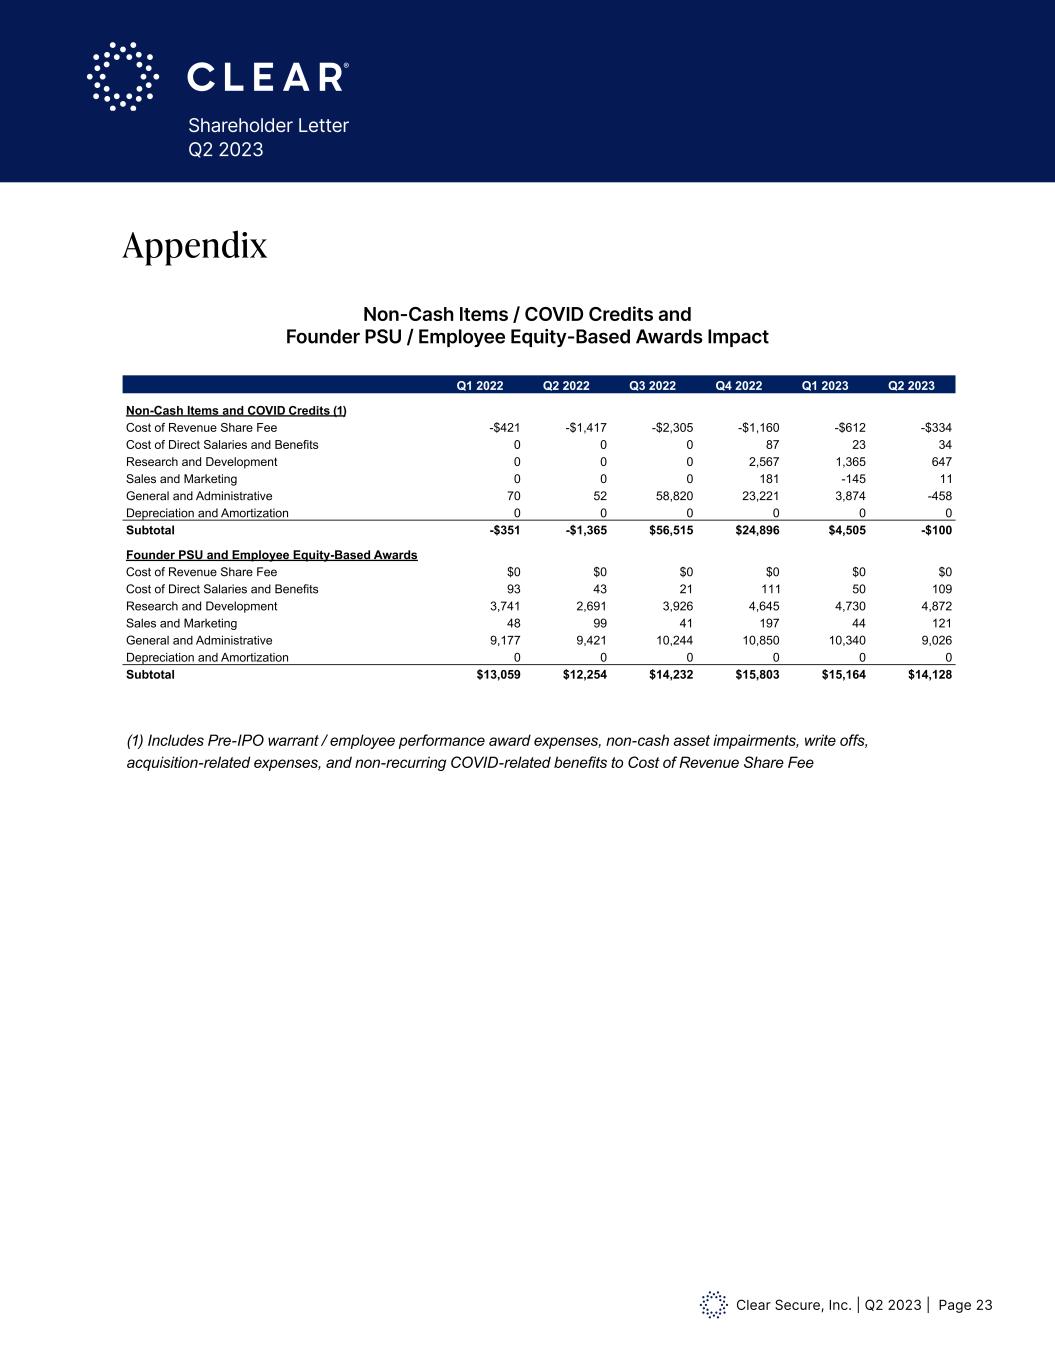
Clear Secure, Inc. | Q2 2023 | Page 23 Shareholder Letter Q2 2023 Appendix CLEAR P&L Q1 2022 Q2 2022 Q3 2022 Q4 2022 Q1 2023 Q2 2023 Revenue 90,539 102,723 115,919 128,253 132,356 149,871 Q1 2022 Q2 2022 Q3 2022 Q4 2022 Q1 2023 Q2 2023 Non-Cash Items and Covid Credits (1) Cost of Revenue Share Fee -$421 -$1,417 -$2,305 -$1,160 -$612 -$334 Cost of Direct Salaries and Benefits 0 0 0 87 23 34 Research and Development 0 0 0 2,567 1,365 647 Sales and Marketing 0 0 0 181 -145 11 General and Administrative 70 52 58,820 23,221 3,874 -458 Depreciation and Amortization 0 0 0 0 0 0 Subtotal -$351 -$1,365 $56,515 $24,896 $4,505 -$100 Founder PSU and Employee Equity-Based Awards Cost of Revenue Share Fee $0 $0 $0 $0 $0 $0 Cost of Direct Salaries and Benefits 93 43 21 111 50 109 Research and Development 3,741 2,691 3,926 4,645 4,730 4,872 Sales and Marketing 48 99 41 197 44 121 General and Administrative 9,177 9,421 10,244 10,850 10,340 9,026 Depreciation and Amortization 0 0 0 0 0 0 Subtotal $13,059 $12,254 $14,232 $15,803 $15,164 $14,128 (1) Includes Pre-IPO warrant / employee performance award expenses, non-cash asset impairments, write offs, acquisition-related expenses, and non-recurring COVID-related benefits to Cost of Revenue Share Fee Non-Cash Items / COVID Credits and Founder PSU / Employee Equity-Based Awards Impact OVID Credits (1)
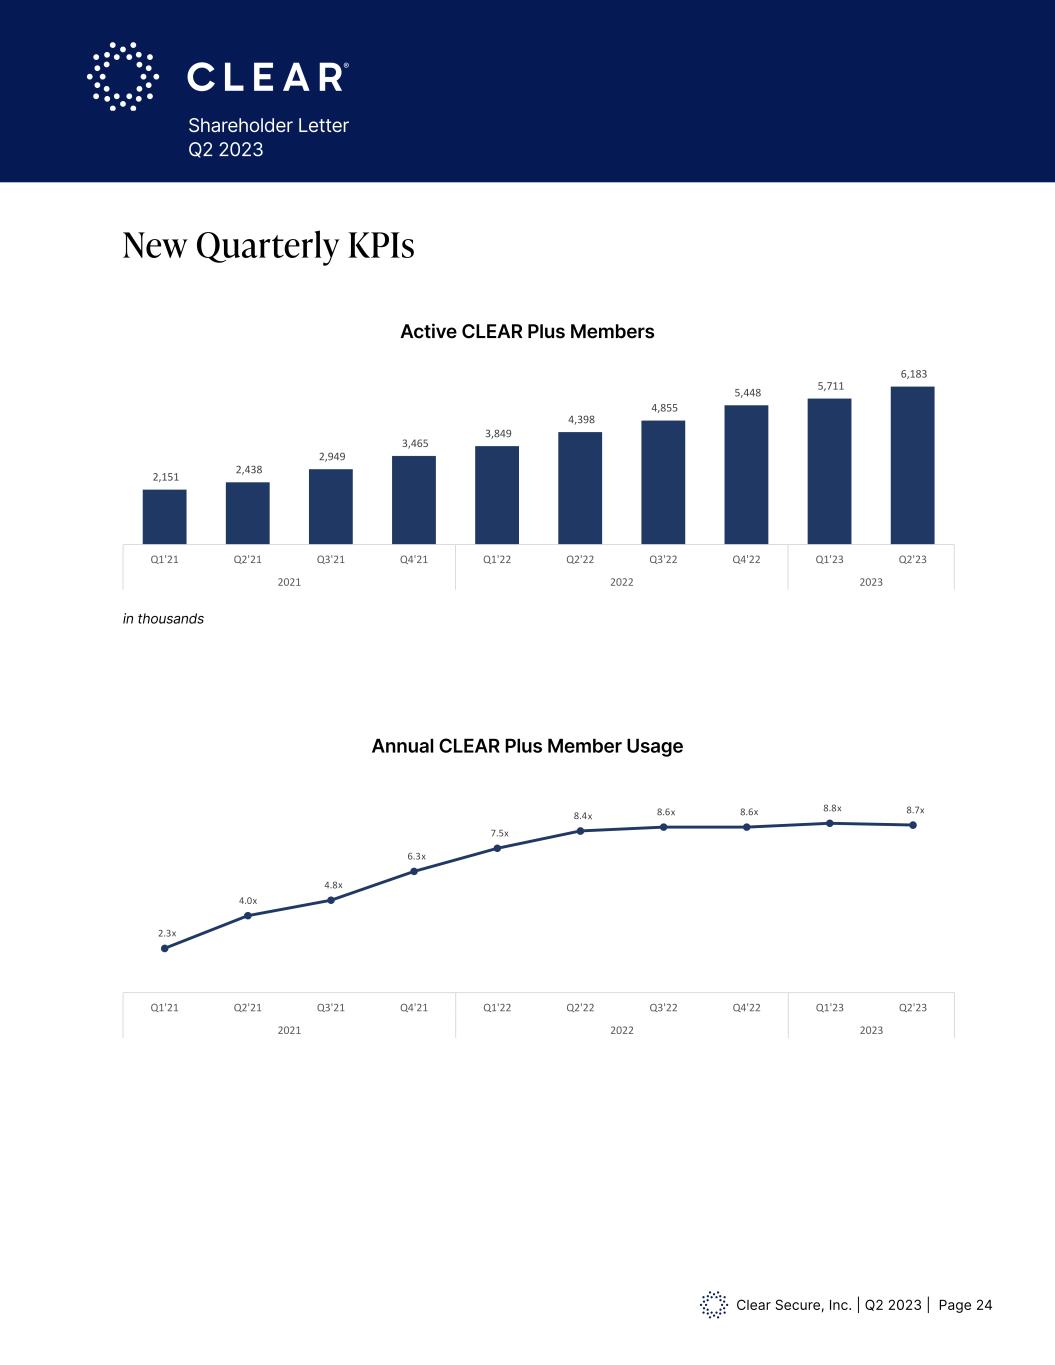
Clear Secure, Inc. | Q2 2023 | Page 24 Shareholder Letter Q2 2023 2,151 2,438 2,949 3,465 3,849 4,398 4,855 5,448 5,711 6,183 Q1'21 Q2'21 Q3'21 Q4'21 Q1'22 Q2'22 Q3'22 Q4'22 Q1'23 Q2'23 2021 2022 2023 Acitve CLEAR Plus Members (Thousands) 2.3 4 4.8 6.3 7.5 8.4 8.6 8.6 8.8 8.7 Q1'21 Q2'21 Q3'21 Q4'21 Q1'22 Q2'22 Q3'22 Q4'22 Q1'23 Q2'23 2021 2022 2023 Annualized CLEAR Plus Member Usage 2,151 2,438 2,949 3,465 3,849 4,398 4,855 5,448 5,711 6,183 Q1'21 Q2'21 Q3'21 Q4'21 Q1'22 Q2'22 Q3'22 Q4'22 Q1'23 Q2'23 2021 2022 2023 Acitve CLEAR Plus Members (Thousands) 2.3 4 4.8 6.3 7.5 8.4 8.6 8.6 8.8 8.7 Q1'21 Q2'21 Q3'21 Q4'21 Q1'22 Q2'22 Q3'22 Q4'22 Q1'23 Q2'23 2021 2022 2023 Annualized CLEAR Plus Member Usage New Quarterly KPIs Active CLEAR Plus Members Annual CLEAR Plus Member Usage in thousands x x x x x x x x x 4.0x
