
Shareholder Letter Q3 2022
Clear Secure, Inc. | Q3 2022 | Page 2 Shareholder Letter Q3 2022 Third Quarter 2022 Financial Highlights (all figures are for Third Quarter 2022 and percentage change is expressed as year-over-year, unless otherwise specified)* Revenue of $115.9 million was up 71.6% while Total Bookings of $145.7 million were up 46.7% Net cash provided by operating activities of $13.2 million; Free Cash Flow of $5.3 million; both figures include payment for credit card partnership accrual Total Cumulative Enrollments of 14.2 million were up 76.3% Annual CLEAR Plus Net Member Retention of 92.2% was up 480 basis points year-over-year and down 210 basis points sequentially Total Cumulative Platform Uses of 117.6 million were up 62.9% Net loss of $65.6 million, which includes $58.8 million non-cash equity-based compensation cost related to vesting of previously issued warrants to United Airlines Adjusted net income of $8.1 million; Adjusted EBITDA of $11.9 million Net loss per common share basic and diluted $0.44, which includes $0.39 of non-cash equity-based compensation cost related to vesting of previously issued warrants to United Airlines Adjusted net income per common share, basic and diluted $0.05 Expect TSA PreCheck® soft launch by year-end 2022 New platform partnerships launched with Avis and Virdee Launched Luis Muñoz Marín International Airport bringing total CLEAR Plus airports to 46 Launched Reserve in Berlin Brandenburg Airport, Miami International Airport, Vancouver International Airport, Toronto Pearson International Airport, Munich International Airport, Edmonton International Airport and Amsterdam Airport Schiphol; now live in 14 airports Declared a $0.25 special cash dividend for Class A and B shareholders as of November 28, 2022, payable on December 7, 2022 * A reconciliation of non-GAAP financial measures to the most comparable GAAP measures is provided at the end of this letter. “ Airport activity remained strong throughout the third quarter including in September, a month in which we typically experience some seasonal slowdown post-Labor Day. We are seeing signs of a business travel recovery, complementing the strength in leisure travel. The Powered by CLEAR solution is gaining strong momentum with our Avis launch - their customers can now skip the counter and go straight to their vehicle. We are well-positioned to scale CLEAR Plus and Powered by CLEAR into Q4 and 2023.” — Caryn Seidman-Becker, CLEAR’s CEO *A reconciliation of non-GAAP financial measures to the most comparable GAAP measures is provided at the end of this letter.
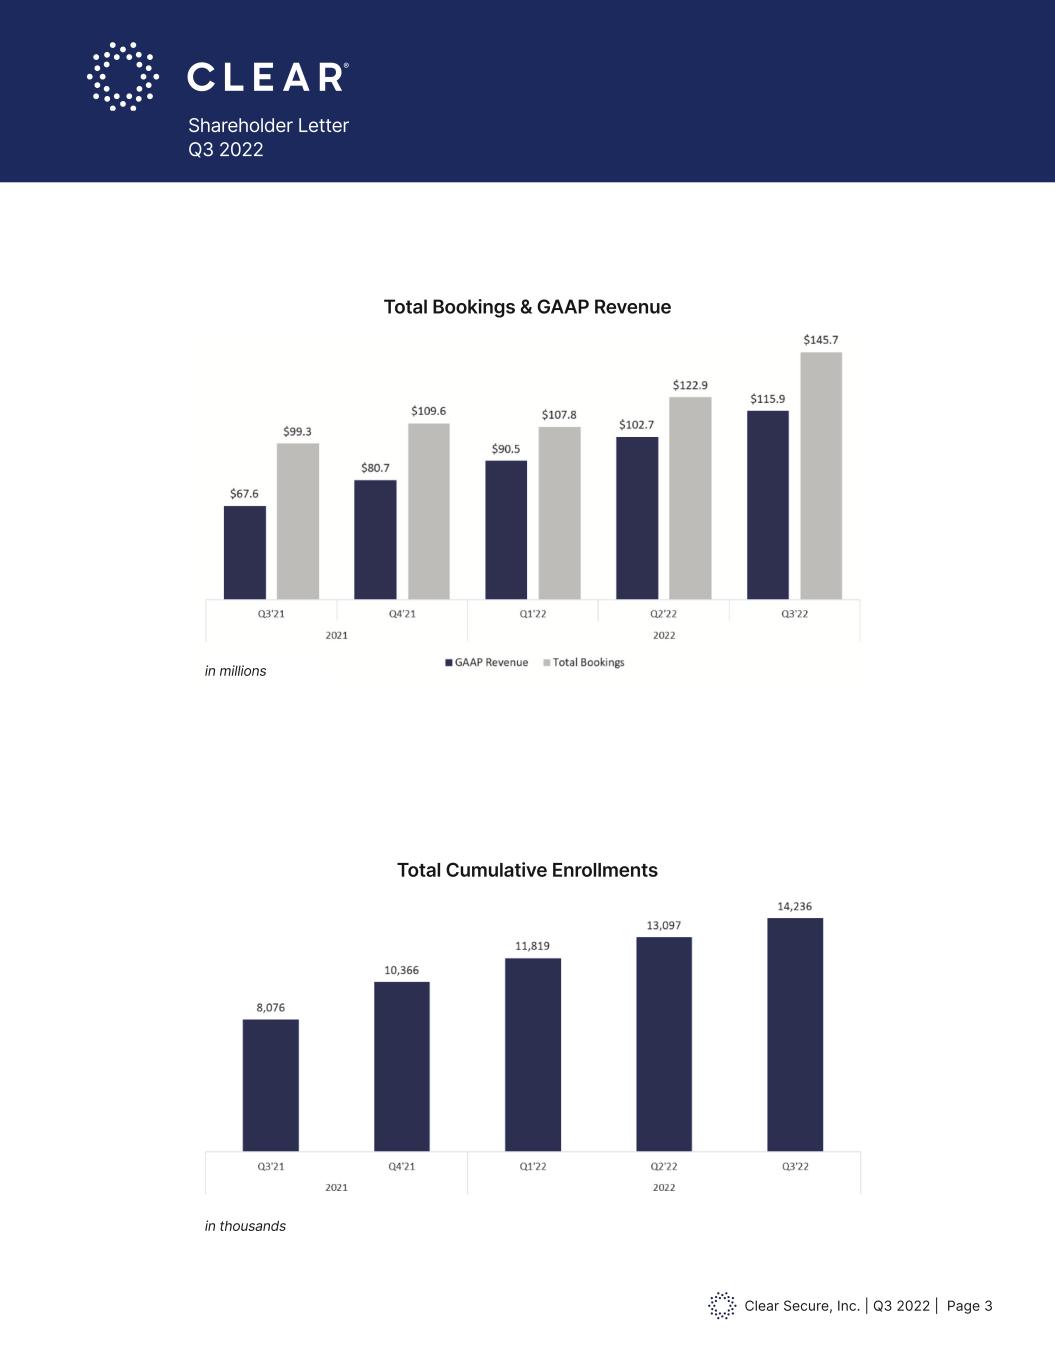
Clear Secure, Inc. | Q3 2022 | Page 3 Shareholder Letter Q3 2022 in millions Total Bookings & GAAP Revenue Total Cumulative Enrollments in thousands
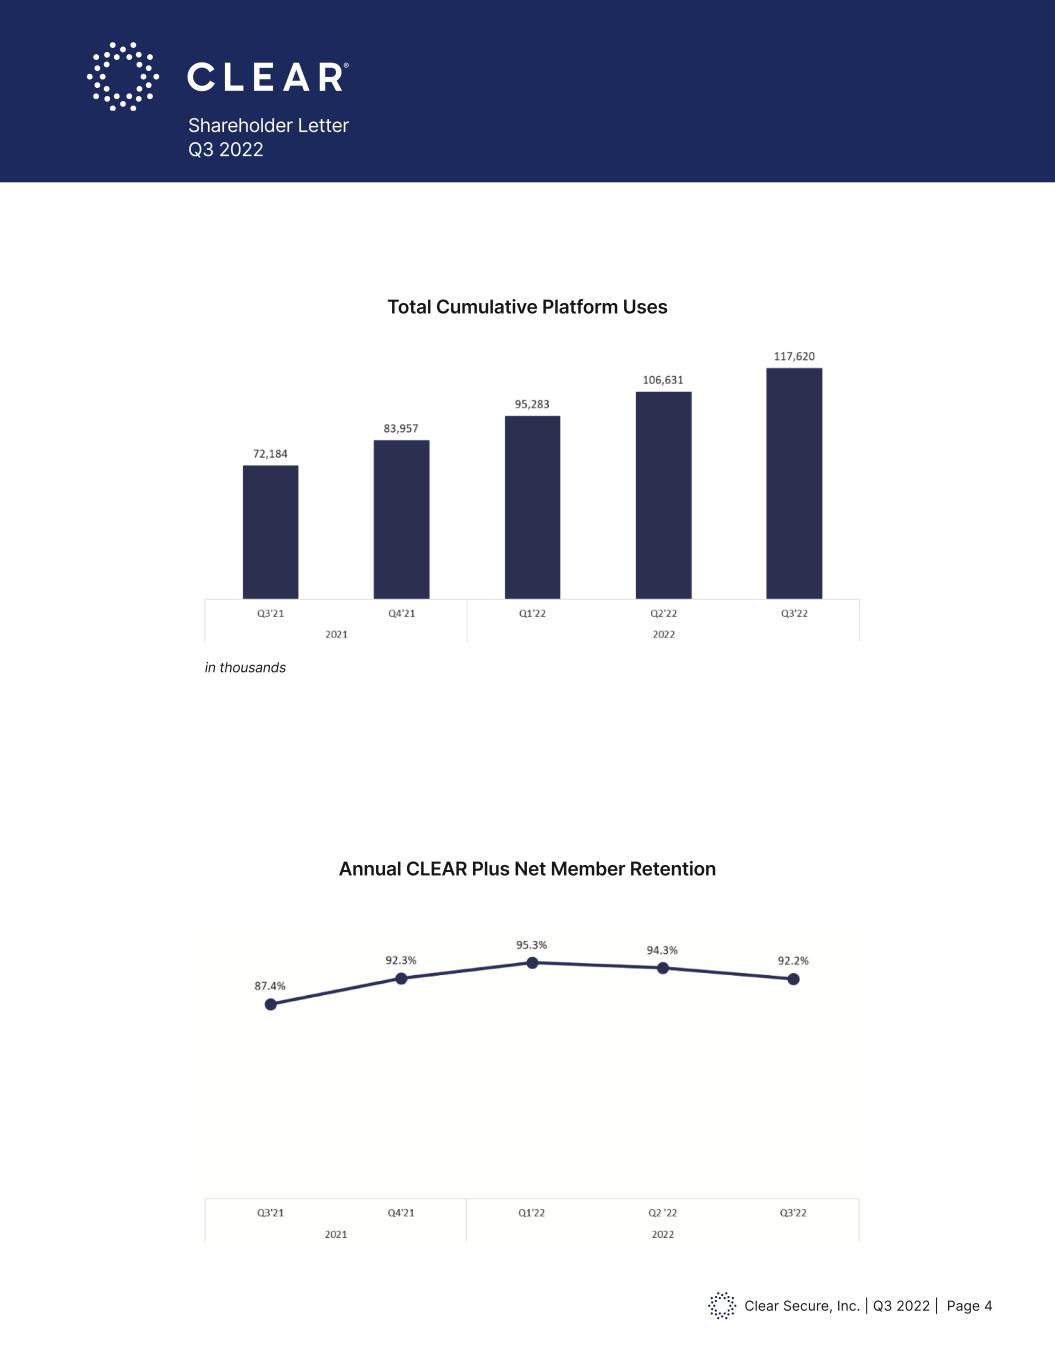
Clear Secure, Inc. | Q3 2022 | Page 4 Shareholder Letter Q3 2022 Total Cumulative Platform Uses Annual CLEAR Plus Net Member Retention in thousands

Clear Secure, Inc. | Q3 2022 | Page 5 Shareholder Letter Q3 2022 Dear Shareholder, At CLEAR we are big believers in the power of platforms. Platforms enable innovation and exponential scale while creating significant value for all their stakeholders: customers, business partners, and the platform owner. The CLEAR platform started in airports - with CLEAR Plus its first customer. In our Q1 2022 letter we talked about our member-centric culture - we have passionate members who crave the CLEAR experience in more places. As an identity platform obsessed with delivering friction-free experiences, our Day 1 vision has always been to create an extensive CLEAR ‘acceptance network’. In our last letter, we talked about network effects - how our platform and network drive utilization and retention. Since 2010 we have expanded our capabilities - growing our members, locations and products. We have built the CLEAR platform to be interoperable - consumers should be able to enroll once and use their identity everywhere (connecting you to all the things that make you, YOU). This may include experiences that CLEAR owns and operates, such as in airports and stadiums, or platform partners’ physical and digital customer journeys. Interoperability increases utility for users, drives adoption on behalf of our partners and expands the CLEAR network. Last quarter we announced the important launch of our Powered by CLEAR verification SDK. This low-code integration creates a single app solution for our partners enabling a friction-free experience for their customers. Importantly, it enables our +14 million members to assert their identity with a selfie and it enables new users to easily enroll within our partners’ experience. The immediate scale we bring means less friction, lower costs, higher adoption and stronger conversion for our partners. Avis is a new partner who recently integrated the Powered by CLEAR verification SDK - creating friction-free experiences for their customers in both their digital and physical environments. Avis customers can now skip the counter and go straight to their vehicle. The Avis use case is a great example of how our large member base brings immediate scale and a great customer experience - early results indicate that almost 40% of users were existing CLEAR members. From Our 2010 Investor Pitch:
Clear Secure, Inc. | Q3 2022 | Page 6 Shareholder Letter Q3 2022 Our airline partners, United and Delta, also believe in a world where travelers do not have to take out their wallets from curb to gate. United recently embedded CLEAR’s mobile enrollment flow into their app (press release here). Friction-free physical experiences enabled by digital identity such as bag-drop, lounge access, concessions and boarding are the travel journey of the future; simple integrations with CLEAR’s vertically integrated identity platform (including +14 million members) will drive mass adoption of these experiences. CLEAR connects you to all the things that make you, YOU. It’s about unlocking friction-free experiences connecting YOU to your contextually relevant information. Far more than digitizing a driver’s license - when renting a car, YOU need to assert more than your age and a valid license, you also need your credit card, your loyalty number and insurance. When traveling, YOU need to declare your name, DOB, your TSA PreCheck® status, your frequent flier number and your boarding pass. When participating in an online employment marketplace, YOU need to prove your credentials (such as that you are a licensed professional) and when you show up that you are the person connected to those credentials1. CLEAR’s platform enables users to frictionlessly affirm their identity and credentials to make everyday experiences safer and easier. Our third quarter 2022 results and fourth quarter guidance reflect continued broad-based strength across business lines and the power of the network effect. As we wrote in our IPO prospectus letter, we are fervent believers in the AND. Our strong balance sheet, Free Cash Flow generation and subscription model enable us to invest in the growth of our business AND return capital to shareholders - whether in the form of opportunistic share repurchases or dividends. We remain focused on growing members, Bookings AND Free Cash Flow while continuing to build a brand that members trust and love. Best, Caryn and Ken 1 Scott Galloway recently wrote a piece entitled “ID” which articulated this point well. Specifically he states “The solution to confirming online identity is a profitable layer/middleman in waiting. Users could set up a single identity account with a trusted provider, who’d then vouch for the uniqueness of that user with any social media company or other online business where they open an account. Sort of a Clear for platforms…No interesting adult human is the same person in every context.” We agree. 1

Clear Secure, Inc. | Q3 2022 | Page 7 Shareholder Letter Q3 2022 Third Quarter 2022 Financial Discussion Third quarter 2022 revenue grew 71.6% as compared to the third quarter of 2021 while Total Bookings increased 46.7%. We saw a continuation of the strong travel trends experienced in the second quarter driving both membership growth and net retention, leading to better-than-expected Total Bookings growth. Our in-airport and partner channels continued to perform well. In addition, we signed several new enterprise partners, such as Avis, and renewed several Health Pass partners. Third quarter 2022 Total Cumulative Enrollments reached 14.2 million, driven by strength in both CLEAR Plus enrollments and platform enrollments. Third quarter 2022 Total Cumulative Platform Uses reached 117.6 million, driven by the continued rebound in air travel leading to increases in both CLEAR Plus verifications and usage in non-aviation platform use cases. Third quarter 2022 Annual CLEAR Plus Net Member Retention was 92.2%, up 480 basis points year-over-year and down 210 basis points sequentially. This performance was driven by strength in gross renewals and winbacks of previously canceled members. As previously discussed, we expect long-term Annual CLEAR Plus Net Member Retention to settle in the upper 80s percentage range, above pre-pandemic levels. Cost of revenue share fee was $14.7 million in the third quarter of 2022 and includes a non-recurring benefit of $1.9 million. Excluding this benefit, cost of revenue share fee was 14.4% of revenue, down 34 basis points year-over-year. Cost of direct salaries and benefits were $26.9 million in the third quarter, up 48.5% year-over-year, and up 6.3% sequentially. As a percentage of revenue, cost of direct salaries and benefits were down 361 basis points year-over-year and 142 basis points sequentially. New airports opened during Q2 2022 account for approximately one-third of the sequential growth. Research and development expense of $16.5 million in the third quarter includes $3.9 million of non-cash equity-based compensation cost. Research and development expense grew 23.7% year-over-year and 15.2% sequentially and as a percentage of revenue it declined 552 basis points year-over-year and grew 29 basis points sequentially. Sales and marketing expense of $10.5 million in the third quarter grew 5.8% year-over-year and declined 7.3% sequentially. As a percentage of revenue, sales and marketing expense declined 564 basis points year-over-year and decreased 198 basis points sequentially. We will continue to be opportunistic and returns-driven when evaluating sales and marketing investments. General and administrative expense of $108.4 million in the third quarter includes $69.1 million of non-cash equity-based compensation cost, of which $58.8 million is related to the vesting of 2.1 million previously issued warrants to United Airlines. Excluding the vesting portion of stock compensation, general and administrative expense grew 10.7% percent year-over-year and 2.9% sequentially and as a percentage of revenue it declined 2,354 basis points year-over-year and 412 basis points sequentially. We will recognize the remaining $3.5 million of the United Airlines warrant non-cash equity-based compensation cost in Q4 2022.
Clear Secure, Inc. | Q3 2022 | Page 8 Shareholder Letter Q3 2022 Third Quarter 2022 Financial Discussion (Cont.) Stock compensation expense of $73.1 million in the third quarter includes $58.8 million of cost relating to the vesting of previously issued warrants to United Airlines representing 2.1 million of Class A Common Stock. Excluding the vesting portion of warrants to United Airlines, stock compensation expense of $14.3 million was up 0.9% year-over-year and 16.0% sequentially. Of this amount approximately $7.6 million relates to non-founder stock compensation expense and $6.6 million relates to the Founders’ Post-IPO Performance Awards (“Founder PSUs”) as detailed in our Final Prospectus, dated June 29, 2021. The Founder PSUs are eligible to vest over a five-year period based on the achievement of pre-determined stock price goals ranging from $46.50 to $93 during measurement periods beginning June 2023 and ending June 2026. The Founder PSUs will be expensed through June 29, 2025 regardless of vesting probability. Third quarter 2022 net loss was $65.6 million, net loss per common share basic and diluted was $0.44. Excluding the non-cash equity-based compensation cost related to the vesting of the previously issued United Airlines warrants, net loss was $6.8 million and net loss per common share basic and diluted was $0.05. Third quarter 2022 adjusted net income was $8.1 million, adjusted net income per common share, basic and diluted was $0.05. Third quarter 2022 net cash provided by operating activities was $13.2 million, Free Cash Flow was $5.3 million and Adjusted EBITDA was $11.9 million. Net cash provided by operating activities and Free Cash Flow include the ~$65 million payment for the credit card partnership accrual. Because of CLEAR Plus revenue recognition policies, when Total Bookings are growing, net cash provided by operating activities and Free Cash Flow may exceed Adjusted EBITDA and net income. As of September 30, 2022, our cash and cash equivalents, including marketable securities and restricted cash were $700.7 million. As of November 9, 2022, the following shares of common stock were outstanding: Class A Common Stock 85,622,383, Class B Common Stock 942,234, Class C Common Stock 39,527,216, and Class D Common Stock 26,337,514 totaling 152,429,347 shares of common stock. During the three-months ended September 30, 2022, the Company used $4.9 million to repurchase and retire 213,100 shares of its Class A Common Stock at an average price of $22.98. Class A Common Stock outstanding reflects the repurchase activity and the 2.1 million previously issued warrants exercised by United Airlines in October 2022. In total, common stock outstanding grew 4.0% year over year, but was flat when excluding the exercise of a total of 5.9 million warrants into Class A Common Stock by United Airlines in December 2021, January 2022, September 2022 and October 2022.
Clear Secure, Inc. | Q3 2022 | Page 9 Shareholder Letter Q3 2022 Fourth Quarter 2022 Guidance We expect fourth quarter 2022 revenue of $123-$125 million and Total Bookings of $142-$146 million. We expect to soft-launch the TSA PreCheck® program in Q4 2022 with revenue contribution starting in 2023 and building throughout the year. TSA PreCheck® Bookings will be recognized as revenue in the quarter they are received.

Clear Secure, Inc. | Q3 2022 | Page 10 Shareholder Letter Q3 2022 CLEAR SECURE, INC. CONDENSED CONSOLIDATED BALANCE SHEETS (UNAUDITED) (dollars in thousands, except per share data) September 30, 2022 December 31, 2021 Assets Current assets: Cash and cash equivalents $ 329,077 $ 280,107 Accounts receivable 2,102 5,331 Marketable securities 342,310 335,228 Prepaid revenue share fee 16,010 10,272 Prepaid expenses and other current assets 16,985 22,140 Total current assets 706,484 653,078 Property and equipment, net 56,053 44,522 Right of use asset, net 18,006 — Intangible assets, net 23,048 22,933 Goodwill 58,807 59,792 Restricted cash 29,333 29,019 Other assets 3,060 3,406 Total assets $ 894,791 $ 812,750 Liabilities and stockholders' equity Current liabilities: Accounts payable $ 8,793 $ 8,808 Accrued liabilities 76,062 67,220 Deferred revenue 255,729 188,563 Total current liabilities 340,584 264,591 Other long term liabilities 23,887 8,691 Total liabilities 364,471 273,282 Commitments and contingencies Class A common stock, $0.00001 par value - 1,000,000,000 shares authorized; 83,158,756 shares issued and 82,969,381 shares outstanding as of September 30, 2022 1 1 Class B common stock, $0.00001 par value - 100,000,000 shares authorized; 942,234 shares issued and outstanding as of September 30, 2022 — — Class C common stock, $0.00001 par value - 200,000,000 shares authorized; 39,875,682 shares issued and outstanding as of September 30, 2022 — — Class D common stock, $0.00001 par value - 100,000,000 shares authorized; 26,337,514 shares issued and outstanding as of September 30, 2022 — — Accumulated other comprehensive loss (1,836) (103) Treasury stock at cost, 189,375 shares as of September 30, 2022 — — Accumulated deficit (90,471) (36,130) Additional paid-in capital 383,974 313,845 Total stockholders’ equity attributable to Clear Secure, Inc. 291,668 277,613 Non-controlling interest 238,652 261,855 Total stockholders’ equity 530,320 539,468 Total liabilities and stockholders’ equity $ 894,791 $ 812,750
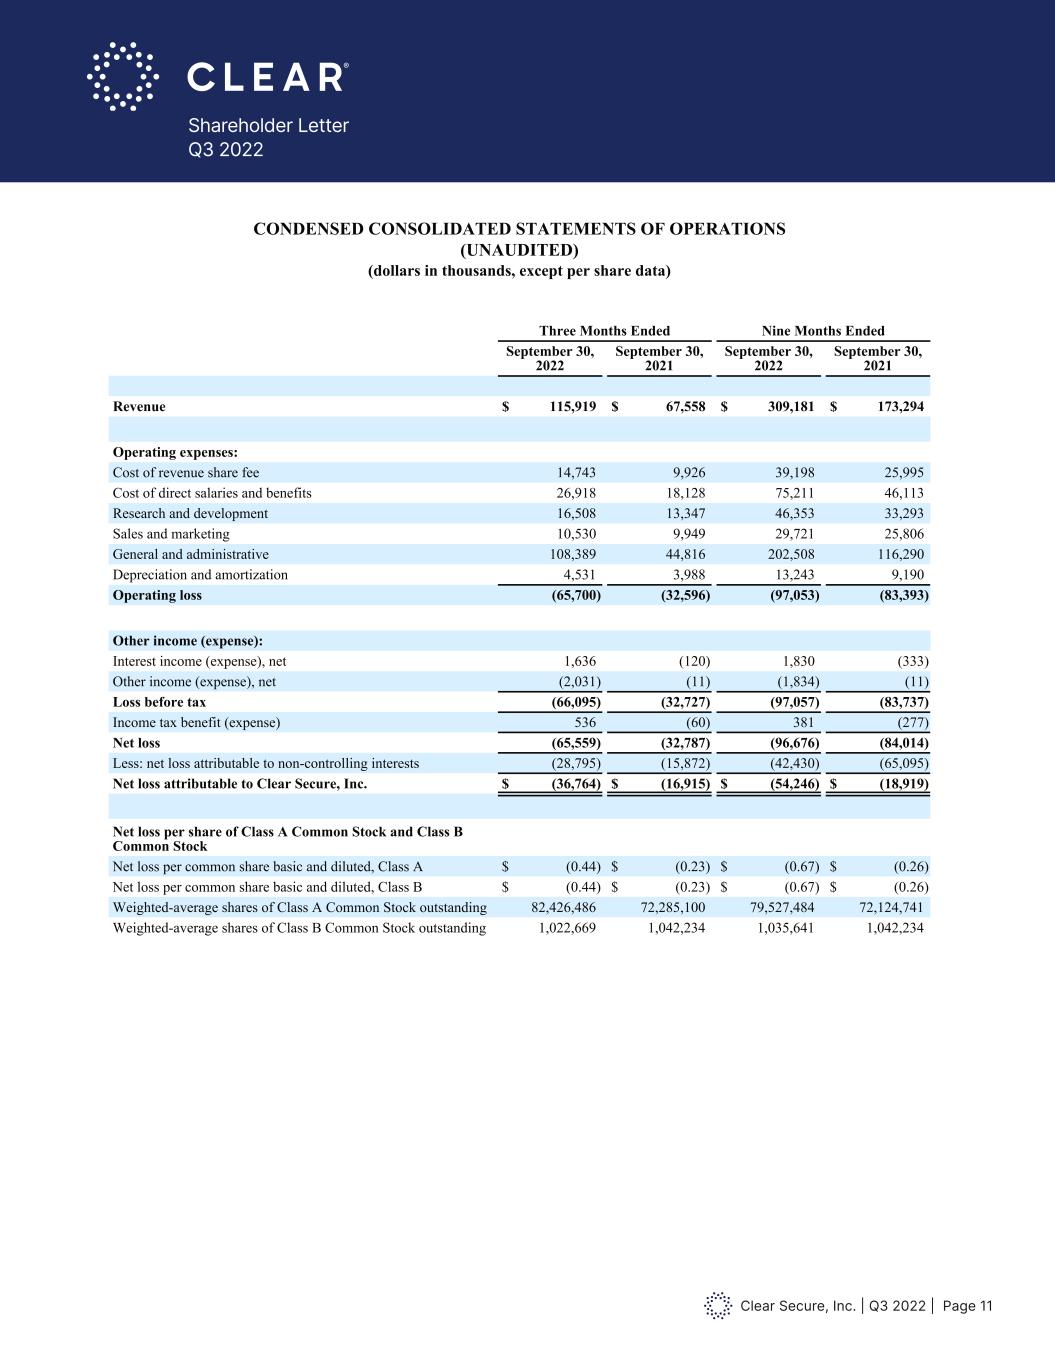
Clear Secure, Inc. | Q3 2022 | Page 11 Shareholder Letter Q3 2022 CLEAR SECURE, INC. CONDENSED CONSOLIDATED STATEMENTS OF OPERATIONS (UNAUDITED) (dollars in thousands, except per share data) Three Months Ended Nine Months Ended September 30, 2022 September 30, 2021 September 30, 2022 September 30, 2021 Revenue $ 115,919 $ 67,558 $ 309,181 $ 173,294 Operating expenses: Cost of revenue share fee 14,743 9,926 39,198 25,995 Cost of direct salaries and benefits 26,918 18,128 75,211 46,113 Research and development 16,508 13,347 46,353 33,293 Sales and marketing 10,530 9,949 29,721 25,806 General and administrative 108,389 44,816 202,508 116,290 Depreciation and amortization 4,531 3,988 13,243 9,190 Operating loss (65,700) (32,596) (97,053) (83,393) Other income (expense): Interest income (expense), net 1,636 (120) 1,830 (333) Other income (expense), net (2,031) (11) (1,834) (11) Loss before tax (66,095) (32,727) (97,057) (83,737) Income tax benefit (expense) 536 (60) 381 (277) Net loss (65,559) (32,787) (96,676) (84,014) Less: net loss attributable to non-controlling interests (28,795) (15,872) (42,430) (65,095) Net loss attributable to Clear Secure, Inc. $ (36,764) $ (16,915) $ (54,246) $ (18,919) Net loss per share of Class A Common Stock and Class B Common Stock Net loss per common share basic and diluted, Class A $ (0.44) $ (0.23) $ (0.67) $ (0.26) Net loss per common share basic and diluted, Class B $ (0.44) $ (0.23) $ (0.67) $ (0.26) Weighted-average shares of Class A Common Stock outstanding 82,426,486 72,285,100 79,527,484 72,124,741 Weighted-average shares of Class B Common Stock outstanding 1,022,669 1,042,234 1,035,641 1,042,234
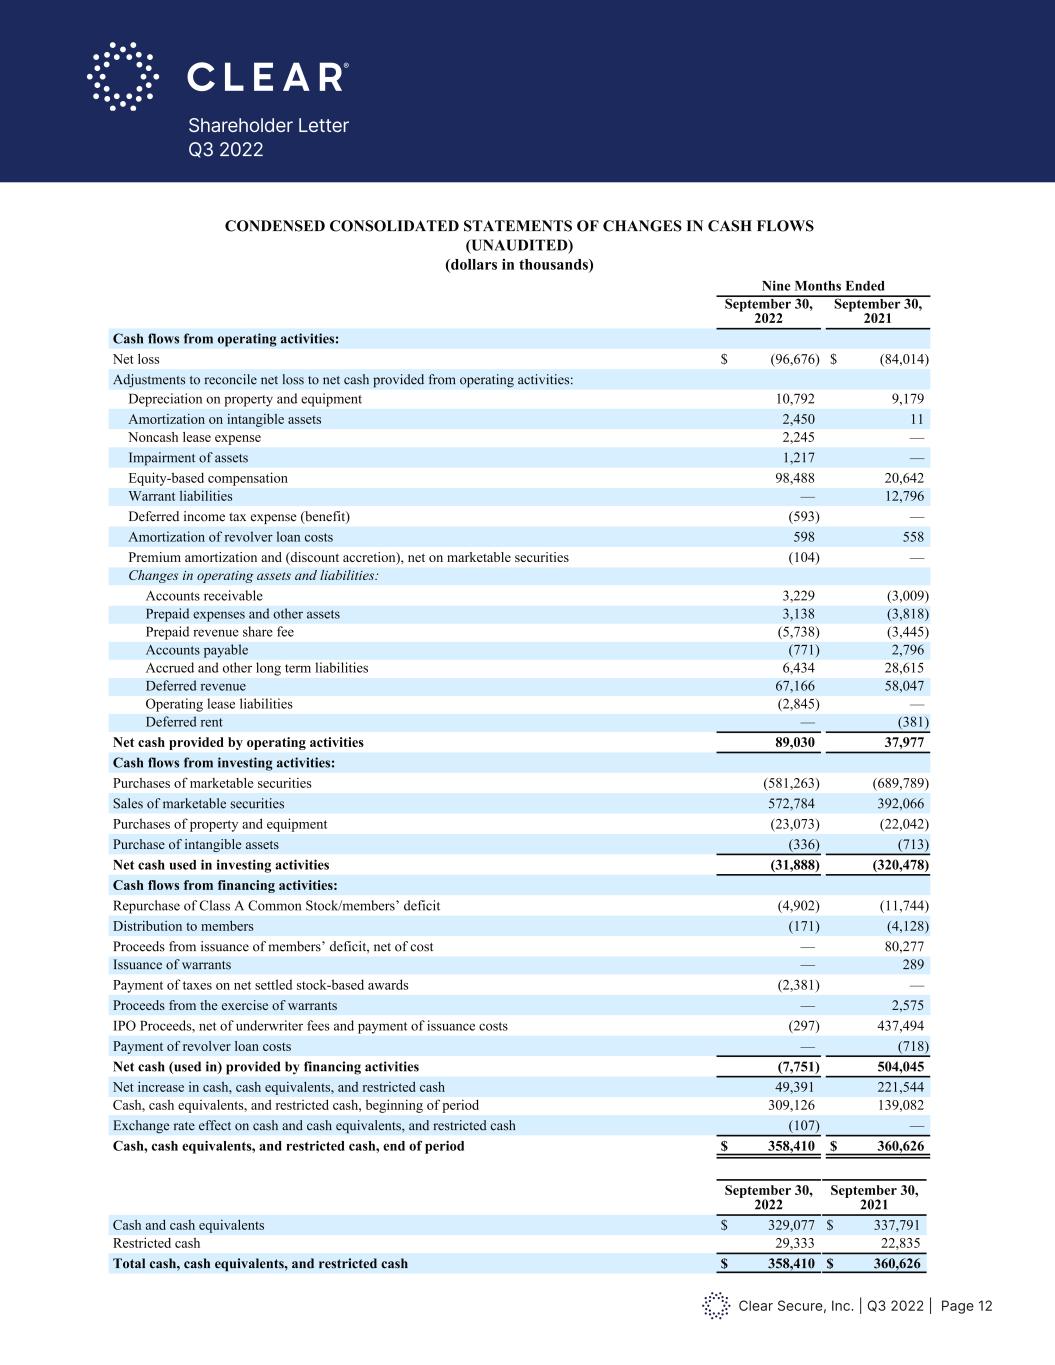
Clear Secure, Inc. | Q3 2022 | Page 12 Shareholder Letter Q3 2022 CLEAR SECURE, INC. CONDENSED CONSOLIDATED STATEMENTS OF CHANGES IN CASH FLOWS (UNAUDITED) (dollars in thousands) Nine Months Ended September 30, 2022 September 30, 2021 Cash flows from operating activities: Net loss $ (96,676) $ (84,014) Adjustments to reconcile net loss to net cash provided from operating activities: Depreciation on property and equipment 10,792 9,179 Amortization on intangible assets 2,450 11 Noncash lease expense 2,245 — Impairment of assets 1,217 — Equity-based compensation 98,488 20,642 Warrant liabilities — 12,796 Deferred income tax expense (benefit) (593) — Amortization of revolver loan costs 598 558 Premium amortization and (discount accretion), net on marketable securities (104) — Changes in operating assets and liabilities: Accounts receivable 3,229 (3,009) Prepaid expenses and other assets 3,138 (3,818) Prepaid revenue share fee (5,738) (3,445) Accounts payable (771) 2,796 Accrued and other long term liabilities 6,434 28,615 Deferred revenue 67,166 58,047 Operating lease liabilities (2,845) — Deferred rent — (381) Net cash provided by operating activities 89,030 37,977 Cash flows from investing activities: Purchases of marketable securities (581,263) (689,789) Sales of marketable securities 572,784 392,066 Purchases of property and equipment (23,073) (22,042) Purchase of intangible assets (336) (713) Net cash used in investing activities (31,888) (320,478) Cash flows from financing activities: Repurchase of Class A Common Stock/members’ deficit (4,902) (11,744) Distribution to members (171) (4,128) Proceeds from issuance of members’ deficit, net of cost — 80,277 Issuance of warrants — 289 Payment of taxes on net settled stock-based awards (2,381) — Proceeds from the exercise of warrants — 2,575 IPO Proceeds, net of underwriter fees and payment of issuance costs (297) 437,494 Payment of revolver loan costs — (718) Net cash (used in) provided by financing activities (7,751) 504,045 Net increase in cash, cash equivalents, and restricted cash 49,391 221,544 Cash, cash equivalents, and restricted cash, beginning of period 309,126 139,082 Exchange rate effect on cash and cash equivalents, and restricted cash (107) — Cash, cash equivalents, and restricted cash, end of period $ 358,410 $ 360,626 September 30, 2022 September 30, 2021 Cash and cash equivalents $ 329,077 $ 337,791 Restricted cash 29,333 22,835 Total cash, cash equivalents, and restricted cash $ 358,410 $ 360,626
Clear Secure, Inc. | Q3 2022 | Page 13 Shareholder Letter Q3 2022 Definitions of Key Performance Indicators To evaluate performance of the business, we utilize a variety of other non-GAAP financial reporting and performance measures. These key measures include Total Bookings, Total Cumulative Enrollments, Total Cumulative Platform Uses, and Annual CLEAR Plus Net Member Retention. Total Bookings Total Bookings represent our total revenue plus the change in deferred revenue during the period. Total Bookings in any particular period reflect sales to new and renewing CLEAR Plus subscribers plus any accrued billings to partners. Management believes that Total Bookings is an important measure of the current health and growth of the business and views it as a leading indicator. Total Cumulative Enrollments We define Total Cumulative Enrollments as the number of enrollments since inception as of the end of the period. An Enrollment is defined as any member who has registered for the CLEAR platform since inception and has a profile (including limited time free trials regardless of conversion to paid membership) net of duplicate and/or purged accounts. This includes CLEAR Plus members who have completed enrollment with CLEAR and have never activated a payment method, plus associated family accounts. Management views this metric as an important tool to analyze the efficacy of our growth and marketing initiatives as new members are potentially a current and leading indicator of revenues. Total Cumulative Platform Uses We define Total Cumulative Platform Uses as the number of individual engagements across CLEAR use cases, including in-airport verifications, since inception as of the end of the period. We also include airport lounge access verifications, sports and entertainment venue verifications and Health Pass surveys since inception as of the end of the period. Management views this metric as an important tool to analyze the level of engagement of our member base which can be a leading indicator of future growth, retention and revenue. Annual CLEAR Plus Net Member Retention We define Annual CLEAR Plus Net Member Retention as one minus the CLEAR Plus net member churn on a rolling 12 month basis. We define “CLEAR Plus net member churn” as total cancellations net of winbacks in the trailing 12 month period divided by the average active CLEAR Plus members as of the beginning of each month within the same 12 month period. Winbacks are defined as reactivated members who have been cancelled for at least 60 days. Active CLEAR Plus members are defined as members who have completed enrollment with CLEAR and have activated a payment method for our in-airport CLEAR Plus service, including their registered family plan members. Active CLEAR Plus members also include those in a grace period of up to 45 days after a billing failure during which time we attempt to collect updated payment information. Management views this metric as an important tool to analyze the level of engagement of our member base, which can be a leading indicator of future growth and revenue, as well as an indicator of customer satisfaction and long term business economics.
Clear Secure, Inc. | Q3 2022 | Page 14 Shareholder Letter Q3 2022 Non-GAAP Financial Measures In addition to our results as determined in accordance with GAAP, we disclose Adjusted EBITDA, Free Cash Flow, Adjusted Net Income (Loss) and Adjusted Net Income (Loss) per Common Share, Basic and Diluted as non-GAAP financial measures that management believes provide useful information to investors. These measures are not financial measures calculated in accordance with GAAP and should not be considered as a substitute for net income (loss), net cash provided by (used in) operating activities or any other operating performance measure calculated in accordance with GAAP, and may not be comparable to a similarly titled measure reported by other companies. Our non-GAAP financial measures are expressed in thousands. Adjusted EBITDA (Loss) We define Adjusted EBITDA (Loss) as net income (loss) adjusted for income taxes, interest (income) expense net, depreciation and amortization, losses on asset disposals, equity-based compensation expense, mark to market of warrant liabilities, other income (expense), net excluding sublease rental income, acquisition-related costs and changes in fair value of contingent consideration. Adjusted EBITDA (Loss) is an important financial measure used by management and our board of directors in determining performance-based compensation for our management and key employees. During the current quarter, we revised our definition of Adjusted EBITDA (Loss) to exclude sublease rental income from our other income (expense) adjustment. We did not revise prior years’ Adjusted EBITDA (Loss) because there was no impact of a similar nature in the prior period. Adjusted Net Income (Loss) We define Adjusted Net Income (Loss) as Net income (loss) attributable to Clear Secure, Inc. adjusted for the net income (loss) attributable to non-controlling interests, equity-based compensation expense, amortization of acquired intangible assets, acquisition-related costs, changes in fair value of contingent consideration and the income tax effect of these adjustments. Adjusted Net Income (Loss) is used in the calculation of Adjusted Net Income (Loss) per Common Share as defined below. Adjusted Net Income (Loss) per Common Share We compute Adjusted Net Income (Loss) per Common Share, Basic as Adjusted Net Income (Loss) divided by Adjusted Weighted-Average Shares Outstanding for our Class A Common Stock, Class B Common Stock, Class C Common Stock and Class D Common Stock assuming the exchange of all vested and outstanding common units in Alclear at the end of each period presented. We do not present Adjusted Net Income (Loss) per Common Share for shares of our Class B Common Stock although they are participating securities based on the assumed conversion of those shares to our Class A Common Stock. We do not present Adjusted Net Income (Loss) per Common Share on a dilutive basis for periods where we have Adjusted Net Loss since we do not assume the conversion of any potentially dilutive equity instruments as the result would be antidilutive. In periods where we have Adjusted Net Income, the Company also calculates Adjusted Net Income per Common Share, Diluted based on the effect of potentially dilutive equity instruments for the periods presented using the treasury stock/if-converted method, as applicable. Adjusted Net Income (Loss) per Common Share is only applicable for periods after June 29, 2021, post the Reorganization Transactions and IPO.

Clear Secure, Inc. | Q3 2022 | Page 15 Shareholder Letter Q3 2022 Adjusted Net Income (Loss) per Common Share (Cont.) Adjusted Net Income (Loss) and Adjusted Net Income (Loss) per Common Share exclude, to the extent applicable, the tax effected impact of non-cash expenses and other items that are not directly related to our core operations. These items are excluded because they are connected to the Company’s long term growth plan and not intended to increase short term revenue in a specific period. Further, to the extent that other companies use similar methods in calculating non-GAAP measures, the provision of supplemental non-GAAP information can allow for a comparison of the company’s relative performance against other companies that also report non-GAAP operating results. Free Cash Flow We define Free Cash Flow as net cash provided by (used in) operating activities adjusted for purchases of property and equipment plus the value of share repurchases over fair value. With regards to our CLEAR Plus subscription service, we generally collect cash from our members upfront for annual subscriptions. As a result, when the business is growing, Free Cash Flow can be a real time indicator of the current trajectory of the business. See below for reconciliations of these non-GAAP financial measures to their most comparable GAAP measures. Forward-Looking Statements This release may contain statements that constitute forward-looking statements within the meaning of the Private Securities Litigation Reform Act of 1995. Investors are cautioned that any and such forward-looking statements are not guarantees of future performance or results and involve risks and uncertainties, and that actual results, developments and events may differ materially from those in the forward-looking statements as a result of various factors, including those described in the Company’s filings with the Securities and Exchange Commission, including the sections titled “Risk Factors” in our Annual Report on Form 10-K for the fiscal year ended December 31, 2021, and in our Quarterly Report on Form 10-Q for the fiscal quarter ended September 30, 2022. The Company disclaims any obligation to update any forward-looking statements contained herein.
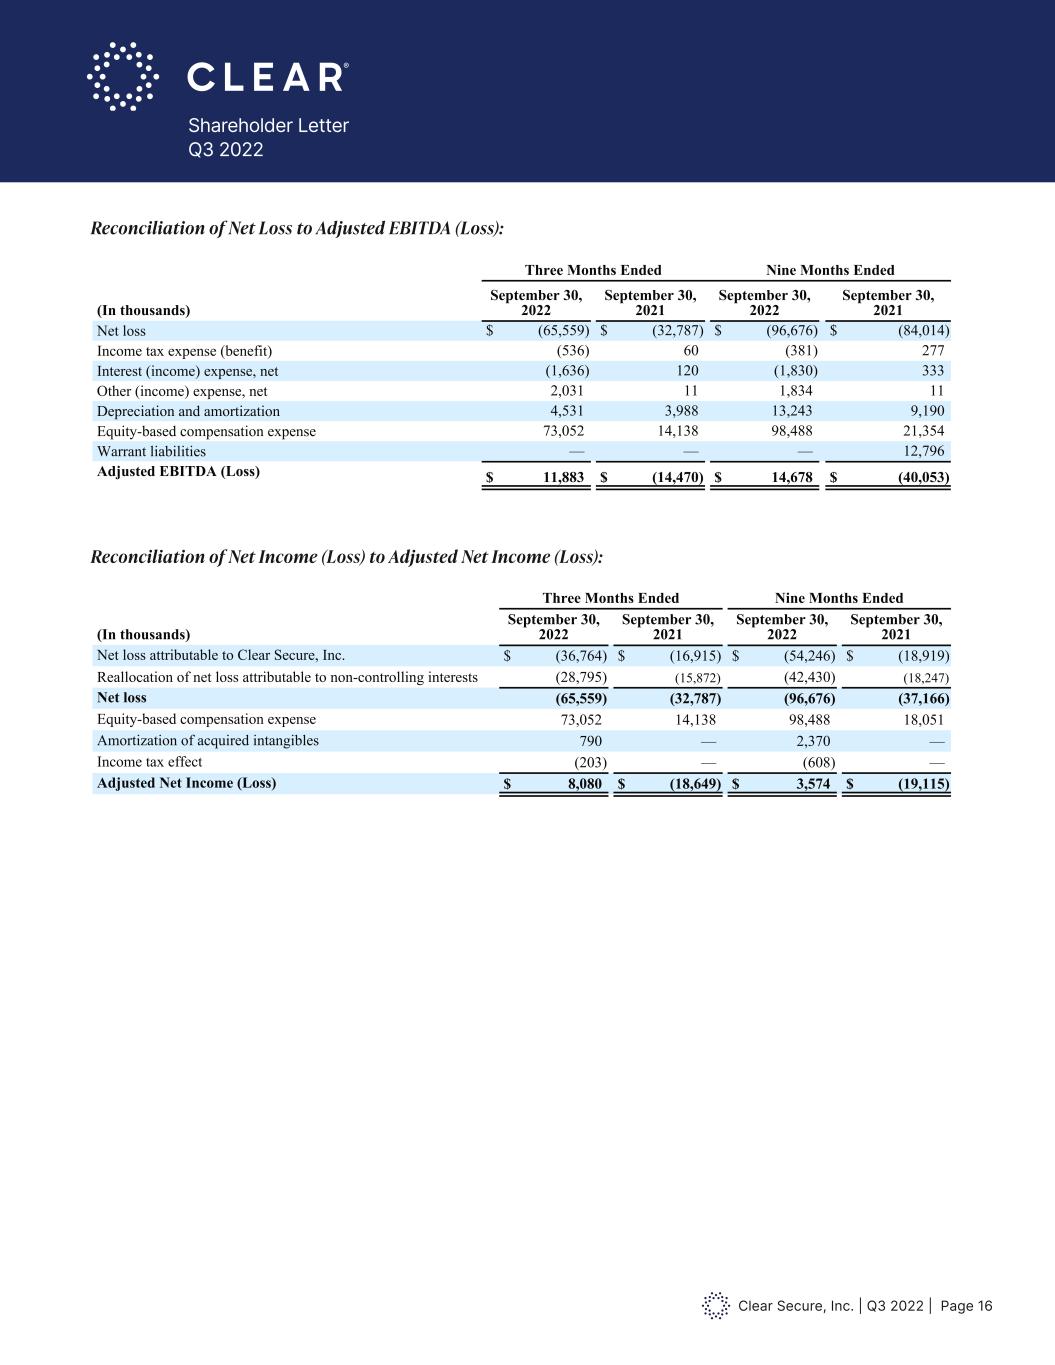
Clear Secure, Inc. | Q3 2022 | Page 16 Shareholder Letter Q3 2022 See below for reconciliations of these non-GAAP financial measures to their most comparable GAAP measures. Reconciliation of Net Loss to Adjusted EBITDA (Loss): Three Months Ended Nine Months Ended (In thousands) September 30, 2022 September 30, 2021 September 30, 2022 September 30, 2021 Net loss $ (65,559) $ (32,787) $ (96,676) $ (84,014) Income tax expense (benefit) (536) 60 (381) 277 Interest (income) expense, net (1,636) 120 (1,830) 333 Other (income) expense, net 2,031 11 1,834 11 Depreciation and amortization 4,531 3,988 13,243 9,190 Equity-based compensation expense 73,052 14,138 98,488 21,354 Warrant liabilities — — — 12,796 Adjusted EBITDA (Loss) $ 11,883 $ (14,470) $ 14,678 $ (40,053) Reconciliation of Net Income (Loss) to Adjusted Net Income (Loss) Three Months Ended Nine Months Ended (In thousands) September 30, 2022 September 30, 2021 September 30, 2022 September 30, 2021 Net loss attributable to Clear Secure, Inc. $ (36,764) $ (16,915) $ (54,246) $ (18,919) Reallocation of net loss attributable to non-controlling interests (28,795) (15,872) (42,430) (18,247) Net loss (65,559) (32,787) (96,676) (37,166) Equity-based compensation expense 73,052 14,138 98,488 18,051 Amortization of acquired intangibles 790 — 2,370 — Income tax effect (203) — (608) — Adjusted Net Income (Loss) $ 8,080 $ (18,649) $ 3,574 $ (19,115) Calculation of Adjusted Weighted-Average Shares Outstanding Basic and Diluted Three Months Ended September 30, 2022 September 30, 2021 Weighted-average number of shares outstanding, basic for Class A Common Stock 82,426,486 72,285,100 Adjustments Assumed weighted-average conversion of issued and outstanding Class B Common Stock 1,022,669 1,042,234 Assumed weighted-average conversion of issued and outstanding Class C Common Stock 40,017,569 44,407,609 Assumed weighted-average conversion of issued and outstanding Class D Common Stock 26,506,830 24,756,018 Assumed weighted-average conversion of vested and outstanding warrants 194,108 2,964,049 Adjusted Weighted-Average Number of Shares Outstanding, Basic 150,167,662 145,455,010 Weighted-average impact of unvested RSAs 482,379 — Weighted-average impact of unvested RSUs 450,637 — Total incremental shares 933,016 — Adjusted Weighted-Average Number of Shares Outstanding, Diluted 151,100,678 145,455,010 See below for reconciliations of these non-GAAP financial measures to their most comparable GAAP measures. Reconciliation of Net Loss to Adjusted EBITDA (Loss): Three Months Ended Nine Months Ended (In thousands) September 30, 2022 September 30, 2021 September 0, 2022 September 30, 2021 Net loss $ (65,559) $ (32,787) $ (96,676) $ (84,014) Income tax expense (benefit) (536) 60 (381) 277 Interest (income) expense, net (1,636) 120 (1,830) 333 Other (income) expense, net 2,031 11 1,834 11 Depreciation and amortization 4,531 3,988 13,243 9,190 Equity-based compensation expense 73,052 14,138 98,488 21,354 Warrant liabilities — — — 12,796 Adjusted EBITDA (Loss) $ 11,883 $ (14,470) $ 14,678 $ (40,053) Reconciliation of Net Income (Loss) to Adjusted Net Income (Loss) Three Months Ended Nine Months Ended (In thousands) September 30, 2022 September 30, 2021 September 30, 2022 September 30, 2021 Net loss attributable to Clear Secure, Inc. $ (36,764) $ (16,915) $ (54,246) $ (18,919) Reallocation of net loss attributable to non-controlling interests (28,795) (15,872) (42,430) (18,247) Net loss (65,559) (32,787) (96,676) (37,166) Equity-based compensation expense 73,052 14,138 98,488 18,051 Amortization of acquired intangibles 790 — 2,370 — Income tax effect (203) — (608) — Adjusted Net Income (Loss) $ 8,080 $ (18,649) $ 3,574 $ (19,115) Calculation of Adjusted Weighted-Average Shares Outstanding Basic and Diluted Three Months Ended September 30, 2022 September 30, 2021 Weighted-average number of shares outstanding, basic for Class A Common Stock 82,426,486 72,285,100 Adjustments Assumed weighted-average conversion of issued and outstanding Class B Common Stock 1,022,669 1,042,234 Assumed weighted-average conversion of issued and outstanding Class C Common Stock 40,017,569 44,407,609 Assumed weighted-average conversion of issued and outstanding Class D Common Stock 26,506,830 24,756,018 Assumed weighted-average conversion of vested and outstanding warrants 194,108 2,964,049 Adjusted Weighted-Average Number of Shares Outstanding, Basic 150,167,662 145,455,010 Weighted-average impact of unvested RSAs 482,379 — Weighted-average impact of unvested RSUs 450,637 — Total incremental shares 933,016 — Adjusted Weighted-Average Number of Shares Outstanding, Diluted 151,100,678 145,455,010 R conciliation f Net Loss to Adjusted EBITDA (Loss): Reconciliation of Net Income (Loss) to Adjusted Net Income (Loss):
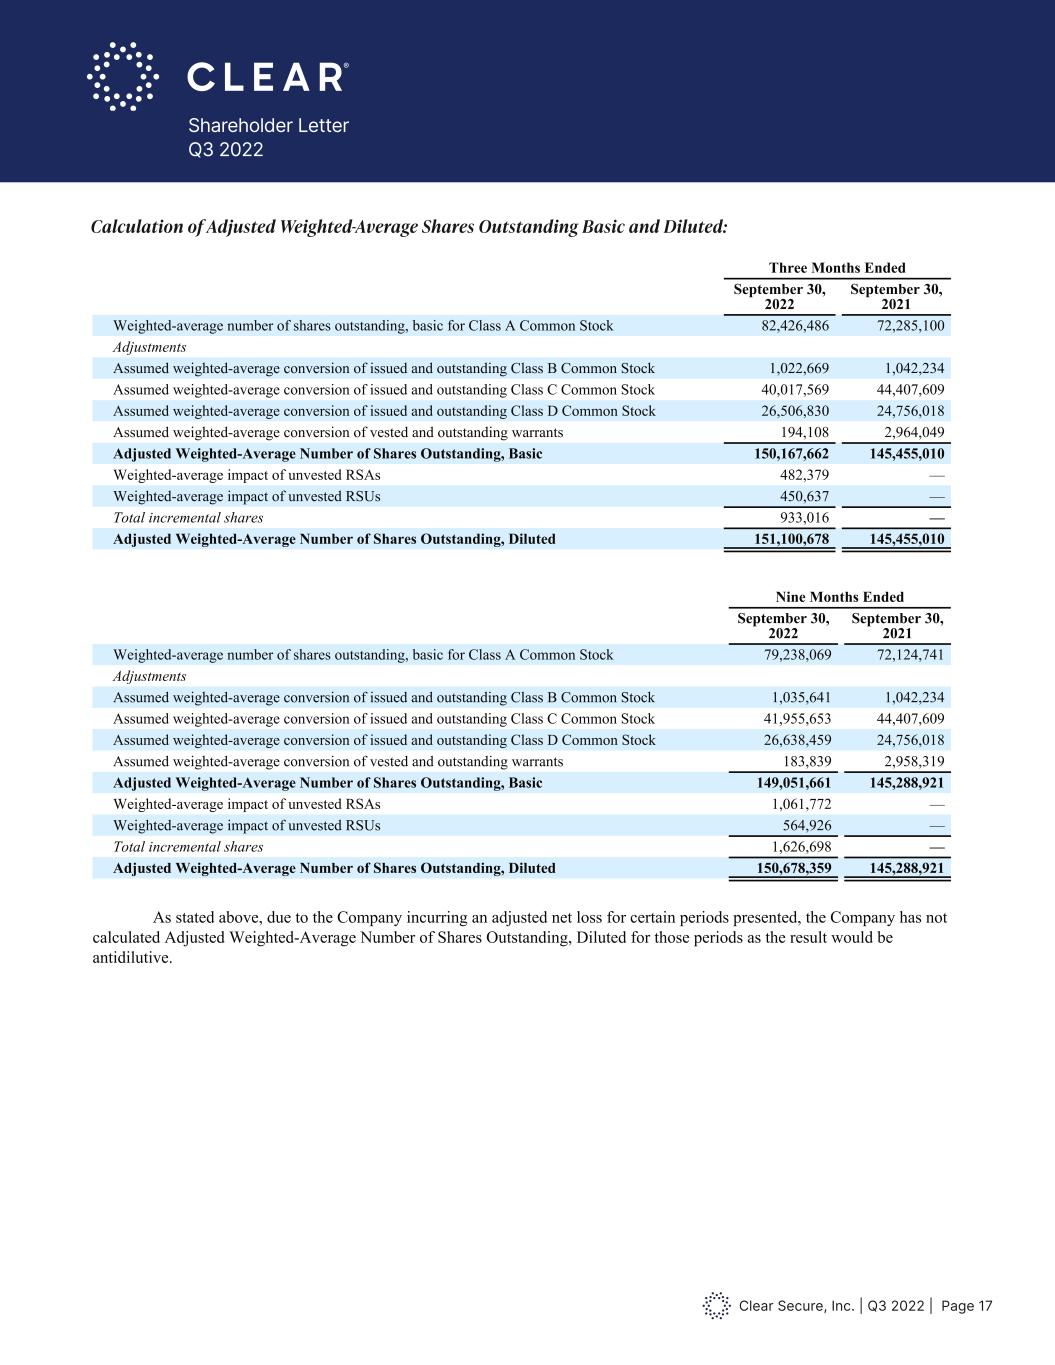
Clear Secure, Inc. | Q3 2022 | Page 17 Shareholder Letter Q3 2022 See below for reconciliations of these non-GAAP financial measures to their most comparable GAAP measures. Reconciliation of Net Loss to Adjusted EBITDA (Loss): Three Months Ended Nine Months Ended (In thousands) September 30, 2022 September 30, 2021 September 30, 2022 September 30, 2021 Net loss $ (65,559) $ (32,787) $ (96,676) $ (84,014) Income tax expense (benefit) (536) 60 (381) 277 Interest (income) expense, net (1,636) 120 (1,830) 333 Other (income) expense, net 2,031 11 1,834 11 Depreciation and amortization 4,531 3,988 13,243 9,190 Equity-based compensation expense 73,052 14,138 98,488 21,354 Warrant liabilities — — — 12,796 Adjusted EBITDA (Loss) $ 11,883 $ (14,470) $ 14,678 $ (40,053) Reconciliation of Net Income (Loss) to Adjusted Net Income (Loss) Three Months Ended Nine Months Ended (In thousands) September 30, 2022 September 30, 2021 September 30, 2022 September 30, 2021 Net loss attributable to Clear Secure, Inc. $ (36,764) $ (16,915) $ (54,246) $ (18,919) Reallocation of net loss attributable to non-controlling interests (28,795) (15,872) (42,430) (18,247) Net loss (65,559) (32,787) (96,676) (37,166) Equity-based compensati n expens 73,052 14,138 98,488 18,051 Amortization of acquired intangibles 790 — 2,370 — Income tax effect (203) — (608) — Adjusted Net Income (Loss) $ 8,080 $ (18,649) $ 3,574 $ (19,115) Calculation of Adjusted Weighted-Average Shares Outstanding Basic and Diluted Three Months Ended September 30, 2022 September 30, 2021 Weighted-average number of shares outstanding, basic for Class A Common Stock 82,426,486 72,285,100 Adjustments Assumed weighted-average conversion of issued and outstanding Class B Common Stock 1,022,669 1,042,234 Assumed weighted-average conversion of issued and outstanding Class C Common Stock 40,017,569 44,407,609 Assumed weighted-average conversion of issued and outstanding Class D Common Stock 26,506,830 24,756,018 Assumed weighted-average conversion of vested and outstanding warrants 194,108 2,964,049 Adjusted Weighted-Average Number of Shares Outstanding, Basic 150,167,662 145,455,010 Weighted-average impact of unvested RSAs 482,379 — Weighted-average impact of unvested RSUs 450,637 — Total incremental shares 933,016 — Adjusted Weighted-Average Number of Shares Outstanding, Diluted 151,100,678 145,455,010 Nine Months Ended September 30, 2022 September 30, 2021 Weighted-average number of shares outstanding, basic for Class A Common Stock 79,238,069 72,124,741 Adjustments Assumed weighted-average conversion of issued and outstanding Class B Common Stock 1,035,641 1,042,234 Assumed weighted-average conversion of issued and outstanding Class C Common Stock 41,955,653 44,407,609 Assumed weighted-average conversion of issued and outstanding Class D Common Stock 26,638,459 24,756,018 Assumed weighted-average conversion of vested and outstanding warrants 183,839 2,958,319 Adjusted Weighted-Average Number of Shares Outstanding, Basic 149,051,661 145,288,921 Weighted-average impact of unvested RSAs 1,061,772 — Weighted-average impact of unvested RSUs 564,926 — Total incremental shares 1,626,698 — Adjusted Weighted-Average Number of Shares Outstanding, Diluted 150,678,359 145,288,921 As stated above, due to the Company incurring an adjusted net loss for certain periods presented, the Company has not calculated Adjusted Weighted-Average Number of Shares Outstanding, Diluted for those periods as the result would be antidilutive. Calculation of Adjusted Basic Net Income (Loss) per Common Share, Basic Three Months Ended Nine Months Ended September 30, 2022 September 30, 2021 September 30, 2022 September 30, 2021 Adjusted Net Income (Loss) 8,080 (18,649) 3,574 (19,115) Adjusted Weighted- Average Number of Shares Outstanding, Basic 150,167,662 145,455,010 149,051,661 145,288,921 Adjusted Net Income (Loss) per Common Share, Basic $ 0.05 $ (0.13) $ 0.02 $ (0.13) Calculation of Adjusted Net Income (Loss) per Common Share, Diluted Three Months Ended Nine Months Ended September 30, 2022 September 30, 2022 Adjusted Net Income 8,080 3,574 Adjusted Weighted-Average Number of Shares Outstanding, Diluted 151,100,678 150,678,359 Adjusted Net Income per Common Share, Diluted: $ 0.05 $ 0.02 Below is a summary of the Company’s Adjusted Net Income (Loss) per Common Share: Three Months Ended Nine Months Ended September 30, 2022 September 30, 2021 September 30, 2022 September 30, 2021 Adjusted Net Income (Loss) per Common Share, Basic $ 0.05 $ (0.13) $ 0.02 $ (0.13) Adjusted Net Income (Loss) per Common Share, Diluted $ 0.05 $ (0.13) $ 0.02 $ (0.13) Calculation of Adjusted Weighted-Average Shares Outstanding Basic and Diluted:

Clear Secure, Inc. | Q3 2022 | Page 18 Shareholder Letter Q3 2022 Nine Months Ended September 30, 2022 September 30, 2021 Weighted-average number of shares outstanding, basic for Class A Common Stock 79,238,069 72,124,741 Adjustments Assumed weighted-average conversion of issued and outstanding Class B Common Stock 1,035,641 1,042,234 Assumed weighted-average conversion of issued and outstanding Class C Common Stock 41,955,653 44,407,609 Assumed weighted-average conversion of issued and outstanding Class D Common Stock 26,638,459 24,756,018 Assumed weighted-average conversion of vested and outstanding warrants 183,839 2,958,319 Adjusted Weighted-Average Number of Shares Outstanding, Basic 149,051,661 145,288,921 Weighted-average impact of unvested RSAs 1,061,772 — Weighted-average impact of unvested RSUs 564,926 — Total incremental shares 1,626,698 — Adjusted Weighted-Average Number of Shares Outstanding, Diluted 150,678,359 145,288,921 As stated above, due to the Company incurring an adjusted net loss for certain periods presented, the Company has not calculated Adjusted Weighted-Average Number of Shares Outstanding, Diluted for those periods as the result would be antidilutive. Calculation of Adjusted Basic Net Income (Loss) per Common Share, Basic Three Months Ended Nine Months Ended September 30, 2022 September 30, 2021 September 30, 2022 September 30, 2021 Adjusted Net Income (Loss) 8,080 (18,649) 3,574 (19,115) Adjusted Weighted- Average Number of Shares Outstanding, Basic 150,167,662 145,455,010 149,051,661 145,288,921 Adjusted Net Income (Loss) per Common Share, Basic $ 0.05 $ (0.13) $ 0.02 $ (0.13) Calculation of Adjusted Net Income (Loss) per Common Share, Diluted Three Months Ended Nine Months Ended September 30, 2022 September 30, 2022 Adjusted Net Income 8,080 3,574 Adjusted Weighted-Average Number of Shares Outstanding, Diluted 151,100,678 150,678,359 Adjusted Net Income per Common Share, Diluted: $ 0.05 $ 0.02 Below is a summary of the Company’s Adjusted Net Income (Loss) per Common Share: Three Months Ended Nine Months Ended September 30, 2022 September 30, 2021 September 30, 2022 September 30, 2021 Adjusted Net Income (Loss) per Common Share, Basic $ 0.05 $ (0.13) $ 0.02 $ (0.13) Adjusted Net Income (Loss) per Common Share, Diluted $ 0.05 $ (0.13) $ 0.02 $ (0.13) Nine Months Ended September 30, 2022 September 30, 2021 Weighted-average number of shares outstanding, basic for Class A Common Stock 79,238,069 72,124,741 Adjustments Assumed weighted-average conversion of issued and outstanding Class B Common Stock 1,035,641 1,042,234 Assumed weighted-average conversion of issued and outstanding Class C Common Stock 41,955,653 44,407,609 Assumed weighted-average conversion of issued and outstanding Class D Common Stock 26,638,459 24,756,018 Assumed weighted-average conversion of vested and outstanding warrants 183,839 2,958,319 Adjusted Weighted-Average Number of Shares Outstanding, Basic 149,051,661 145,288,921 Weighted-average impact of unvested RSAs 1,061,772 — Weighted-average impact of unvested RSUs 564,926 — Total incremental shares 1,626,698 — Adjusted Weighted-Average Number of Shares Outstanding, Diluted 150,678,359 145,288,921 As stated above, due to the Company incurring an adjusted net loss for certain periods presented, the Company has not calculated Adjusted Weighted-Average Number of Shares Outstanding, Diluted for those periods as the result would be antidilutive. Calculation of Adjusted Basic Net Income (Loss) per Common Share, Basic Three Months Ended Nine Months Ended September 30, 2022 September 30, 2021 September 30, 2022 September 30, 2021 Adjusted Net Income (Loss) 8,080 (18,649) 3,574 (19,115) djusted Weighted- Average Number of Shares Outstanding, Basic 150,167,662 145,455,010 149,051,661 145,288,921 Adjusted Net Inco e (Loss) per Common Share, Basic $ 0.05 $ (0.13) $ 0.02 $ (0.13) Calculation of Adjusted Net Income (Loss) per Common Share, Diluted Three Months Ended Nine Months Ended September 30, 2022 September 30, 2022 Adjusted Net Income 8,080 3,574 Adjusted Weighted-Average Number of Shares Outstanding, Diluted 151,100,678 150,678,359 Adjusted Net Income per Common Share, Diluted: $ 0.05 $ 0.02 Below is a summary of the Company’s Adjusted Net Income (Loss) per Common Share: Three Months Ended Nine Months Ended September 30, 2022 September 30, 2021 September 30, 2022 September 30, 2021 Adjusted Net Income (Loss) per Common Share, Basic $ 0.05 $ (0.13) $ 0.02 $ (0.13) Adjusted Net Income (Loss) per Common Share, Diluted $ 0.05 $ (0.13) $ 0.02 $ (0.13) Calculation of Adjusted Basic Net Income (Loss) per Common Share, Basic: Calculation of Adjusted Net Income (Loss) per Common Share, Diluted: Reconciliation of Net cash provided by operating activities to Free Cash Flow: Three Months Ended Nine Months Ended (In thousands) September 30, 2022 September 30, 2021 September 30, 2022 September 30, 2021 Net cash provided by operating activities $ 13,175 $ 34,893 $ 89,030 $ 37,977 Purchases of property and equipment (7,859) (6,832) (23,073) (22,042) Share repurchases over fair value — — — 712 Free Cash Flow $ 5,316 $ 28,061 $ 65,957 $ 16,647 iliation of Net cash provided by oper ting activiti s to Free Cash Flow:
