Shareholder Letter Q3 2021
CLEAR Secure, Inc. | Q3 2021 | Page 2 Shareholder Letter Q3 2021 Third Quarter 2021 Highlights All figures are for Third Quarter 2021 and percentage change is expressed as year over year, unless otherwise specified. Revenue of $67.6 million was up 20% while Total Bookings of $99.3 million were up 89% Total Cumulative Enrollments of 8.1 million were up 58%; new enrollments grew 131% sequentially Annual CLEAR Plus Net Member Retention of 87.4% was up 620 basis points year over year and up 680 basis points sequentially Total Cumulative Platform Uses of 72.2 million were up 27% Net Loss ($32.8) million; Basic and Diluted Net Loss Per Share ($0.23) Net cash provided by operating activities $34.9 million; Free Cash Flow* $28.1 million; Adjusted EBITDA* ($14.5) million Launches include: American Express Platinum Card partnership with CLEAR as embedded benefit, Health Pass partnerships with OpenTable, Resy, Rite Aid, Las Vegas Raiders; additional terminal at LAX International, announced strategic partnership with Checkr CLEAR Health Pass recognized as official vaccine solution by cities including Los Angeles, New York, San Francisco and Seattle * A reconciliation of non-GAAP financial measures to the most comparable GAAP measures is provided at the end of this letter. “ CLEAR’s business continued to accelerate in the third quarter as new enrollments more than doubled sequentially. Our platform continued to gain traction driven by a robust travel recovery, new partners launched in the quarter and continued demand for our secure digital identity and health solutions as the economy reopens. We are proud that the CLEAR platform is emerging as a trusted, market-leading solution for vaccination and testing credential management.” —Caryn Seidman-Becker, CLEAR’s CEO
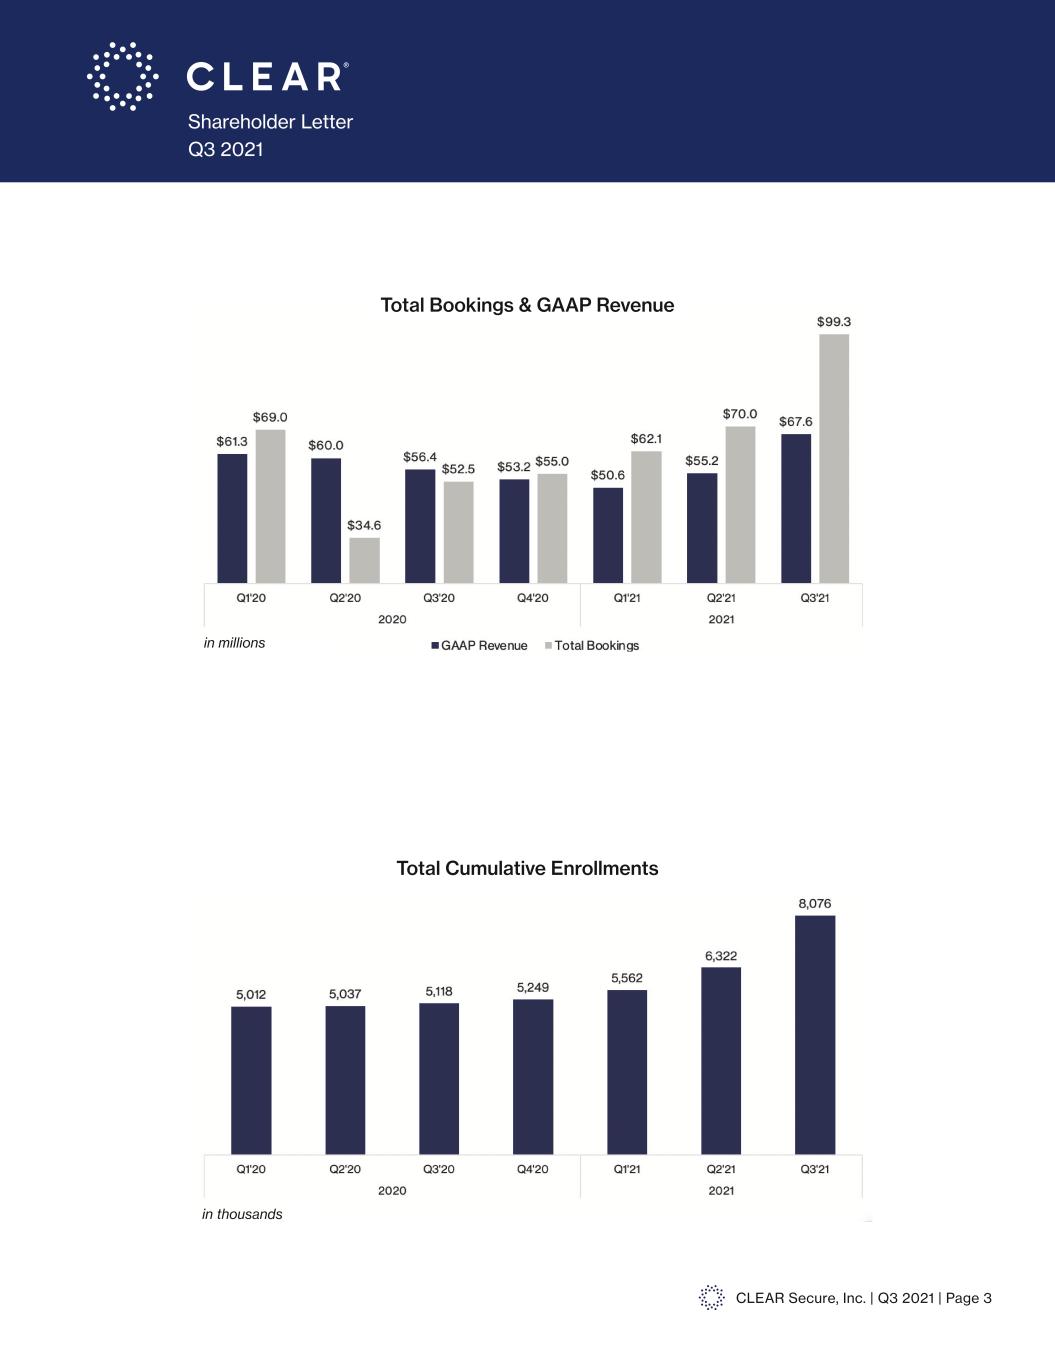
CLEAR Secure, Inc. | Q3 2021 | Page 3 Shareholder Letter Q3 2021 in millions in thousands Total Bookings & GAAP Revenue Total Cumulative Enrollments
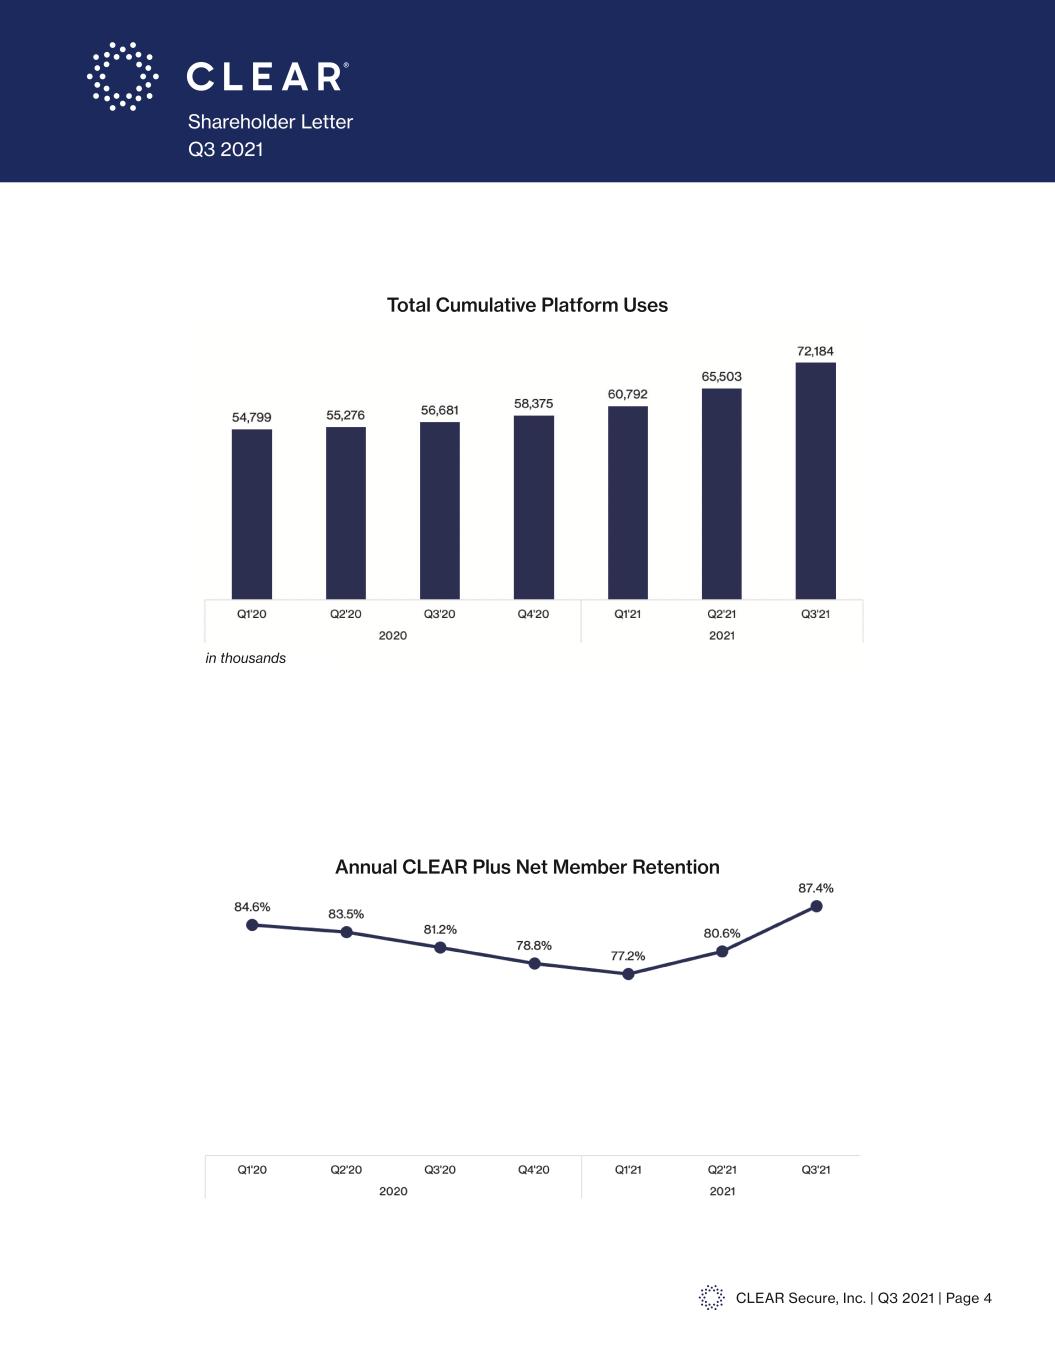
CLEAR Secure, Inc. | Q3 2021 | Page 4 Shareholder Letter Q3 2021 Total Cumulative Platform Uses Annual CLEAR Plus Net Member Retention in thousands
CLEAR Secure, Inc. | Q3 2021 | Page 5 Shareholder Letter Q3 2021 Dear Shareholder, CLEAR’s mission is to make experiences safer and easier. We enable frictionless and trusted journeys by connecting you to all the things that make you YOU. We continue to execute on the dual growth engines in front of us: the continued recovery in travel and the digital transformation of physical experiences. In Q3 our key performance indicators accelerated as we introduced new products and partners which drove new use cases and members. In doing so, CLEAR is becoming a daily habit. The more members and partners use our platform, the more passionate they become about the CLEAR brand, driving additional use cases and member lifetime value. This “CLEAR flywheel” is manifesting in the acceleration of both CLEAR Plus and our B2B platform businesses. The robust travel rebound continued this quarter, despite uncertainty related to the Delta variant. We enrolled a record number of new CLEAR Plus members and our average usage per member was the highest since Q1’20. Overall the results were strong despite travel remaining inconsistent across the US as leisure and business travel trends and international travel regulation had varying impacts by geography. Approximately 40% of our markets are now above 2019 verification volumes, while 60% have yet to reach 2019 levels. The strength of enrollments relative to verifications is a reflection of CLEAR’s increased value to travelers in the new “convenience economy”. The importance of predictable, frictionless and touchless travel has never been greater. We remain bullish on travel: while we do not know when traditional “business travel” will return, we are achieving strong results reinforcing the demand for CLEAR by a wide range of travelers. We continue to see strong growth in our platform, as a record number of members engaged with the CLEAR mobile app this quarter. CLEAR has been helping employers, businesses, venues and live events “Come Back Better” through our Health Pass and digital vaccine card products. CLEAR is emerging as the trusted, turnkey solution for businesses across industries, as we added more than 100 partners including OpenTable, Resy, Chekr, Rite Aid, and the Las Vegas Raiders. As cities make it easier and safer for businesses to keep their doors open, we have partnered with cities such as New York, San Francisco, Los Angeles, and Seattle who all named CLEAR as an approved vaccine verification platform. This expansion of our acceptance network both accelerates member growth and brings additional use cases to millions of engaged and passionate members—creating value for all of our stakeholders. The power of our secure identity platform is becoming evident and we are proud to play a part in helping the economy reopen and getting people back to doing what they love. The CLEAR experience is in fact becoming a daily habit for millions of members, delivering safer and easier experiences for both them and our partners. Best, Caryn and Ken
CLEAR Secure, Inc. | Q3 2021 | Page 6 Shareholder Letter Q3 2021 Financial Discussion Third quarter 2021 revenue grew 20% as compared to the third quarter of 2020 while Total Bookings increased 89% period over period. The rebound in travel has continued faster and stronger than we anticipated driving strong membership growth and net retention, leading to better than expected Total Bookings growth. Our in-airport sales channel continued to perform well, as did our marketing channel (including the recently launched American Express Platinum benefit which launched on July 1). Our business-to-business platform bookings were also strong, driven by new enterprise partners. The strength in our third quarter 2021 Total Bookings is not fully reflected in our third quarter 2021 revenues because our revenues lag behind our Total Bookings (we bill members upfront and recognize that revenue over the life of a membership, usually 12 months). Third quarter 2021 Total Cumulative Enrollments accelerated year over year to 8.1 million, driven by strength in both CLEAR Plus enrollments and platform enrollments. New enrollments in the quarter were 1.8 million and more than doubled sequentially. Third quarter 2021 Total Cumulative Platform Uses reached 72.2 million, representing 27% growth year-over-year, driven by the rapid growth of Health Pass usage and a continued rebound in CLEAR Plus verifications. Platform (mobile) members continued to represent an increased mix in the quarter which in the short term may demonstrate lower frequency usage trends than CLEAR Plus members. Third quarter 2021 Annual CLEAR Plus Net Member Retention increased to 87.4%. Given this is a trailing 12-month metric, the 680 basis point sequential increase implies particularly strong quarterly retention. The performance was driven by strength in gross renewals and winbacks of previously cancelled members. Retention is now above pre-COVID levels. A significant number of members who cancelled their CLEAR Plus subscriptions in 2020 have reactivated this year. Third quarter 2021 costs and expenses of $100.2 million include $14.1 million of non-cash equity- based compensation. Excluding these non-cash items, costs and expenses grew 93% in the third quarter of 2021 as compared to the third quarter of 2020 and 13% on a sequential basis. Costs and expenses in the third quarter of 2020 were depressed due to our proactive management of costs and expenses resulting from the COVID-19 pandemic-driven collapse in travel demand (particularly our Sales and Marketing and Cost of Direct Salaries). Entering the pandemic, consistent with one of our core values “Our Great People” we created a leave of active absence (LOAA) program whereby team members remained with the company and eligible for health benefits despite a reduction in their hours. As travel reaccelerated, this enabled a smooth return of our team and ensured we could serve our members without disruption.
CLEAR Secure, Inc. | Q3 2021 | Page 7 Shareholder Letter Q3 2021 Financial Discussion (cont) On a sequential basis versus second quarter 2021, increased airport staffing aligned with travel volumes drove an increase in Direct Salaries and Benefits. Continued investment in people, technology and product drove a sequential increase in Research and Development and General and Administrative. In addition, certain variable costs embedded in General and Administrative grew in line with our bookings and enrollment performance. Sales and Marketing declined sequentially due to a large event-based marketing effort in Q2, offset in part by higher commission based variable marketing spend. Our member acquisition strategy continues to be economically efficient driven by the powerful combination of our nationwide physical footprint, strong team of more than 1,500 airport Ambassadors and our partners. Third Quarter 2021 net loss of ($32.8) million includes $14.1 million of non-cash equity-based compensation. Excluding these non-cash items, net loss would have been ($18.7) million. Third Quarter 2021 basic and diluted loss per share of ($0.23) includes $0.10 of non-cash equity-based compensation. Excluding these non-cash items, basic and diluted loss per share would have been ($0.13). Third Quarter 2021 net cash provided by operating activities was $34.9 million, Free Cash Flow* was $28.1 million and Adjusted EBITDA* was ($14.5) million. Because of CLEAR Plus revenue recognition policies described above, when Total Bookings are growing, net cash provided by operations and Free Cash Flow* may exceed Adjusted EBITDA* and Net Income. Free Cash Flow* benefited in the quarter from the strong Total Bookings as well as the American Express Platinum partnership, which has positive working capital dynamics. As of September 30, 2021, our cash and cash equivalents, including marketable securities and restricted cash were $696.1 million. As of November 11, 2021, the following shares of common stock were outstanding: Class A 74,268,466, Class B 1,042,234, Class C 44,598,167, and Class D 26,709,821, totaling 146,618,688. * A reconciliation of non-GAAP financial measures to the most comparable GAAP measures is provided at the end of this letter.
CLEAR Secure, Inc. | Q3 2021 | Page 8 Shareholder Letter Q3 2021 Fourth Quarter 2021 Guidance We expect fourth quarter 2021 revenue of $77.5-78.5 million and Total Bookings of $98-102 million. Certain expenses such as Cost of Revenue Share, Sales and Marketing and components of General and Administrative have variable components that can fluctuate based on the level of Total Bookings and new enrollments in the quarter. As a result, positive variances in Total Bookings and enrollments may lead to near term negative variances in profitability metrics while potentially positively benefiting operating cash flow. Our revenue and Total Bookings guidance exclude any contribution from the launch of our TSA PreCheck enrollment service, which we now expect in the first several months of 2022. TSA PreCheck Bookings will be recognized as revenue in the quarter in which they are received. We will continue to incur operating expenses in the fourth quarter associated with the future launch of this program.
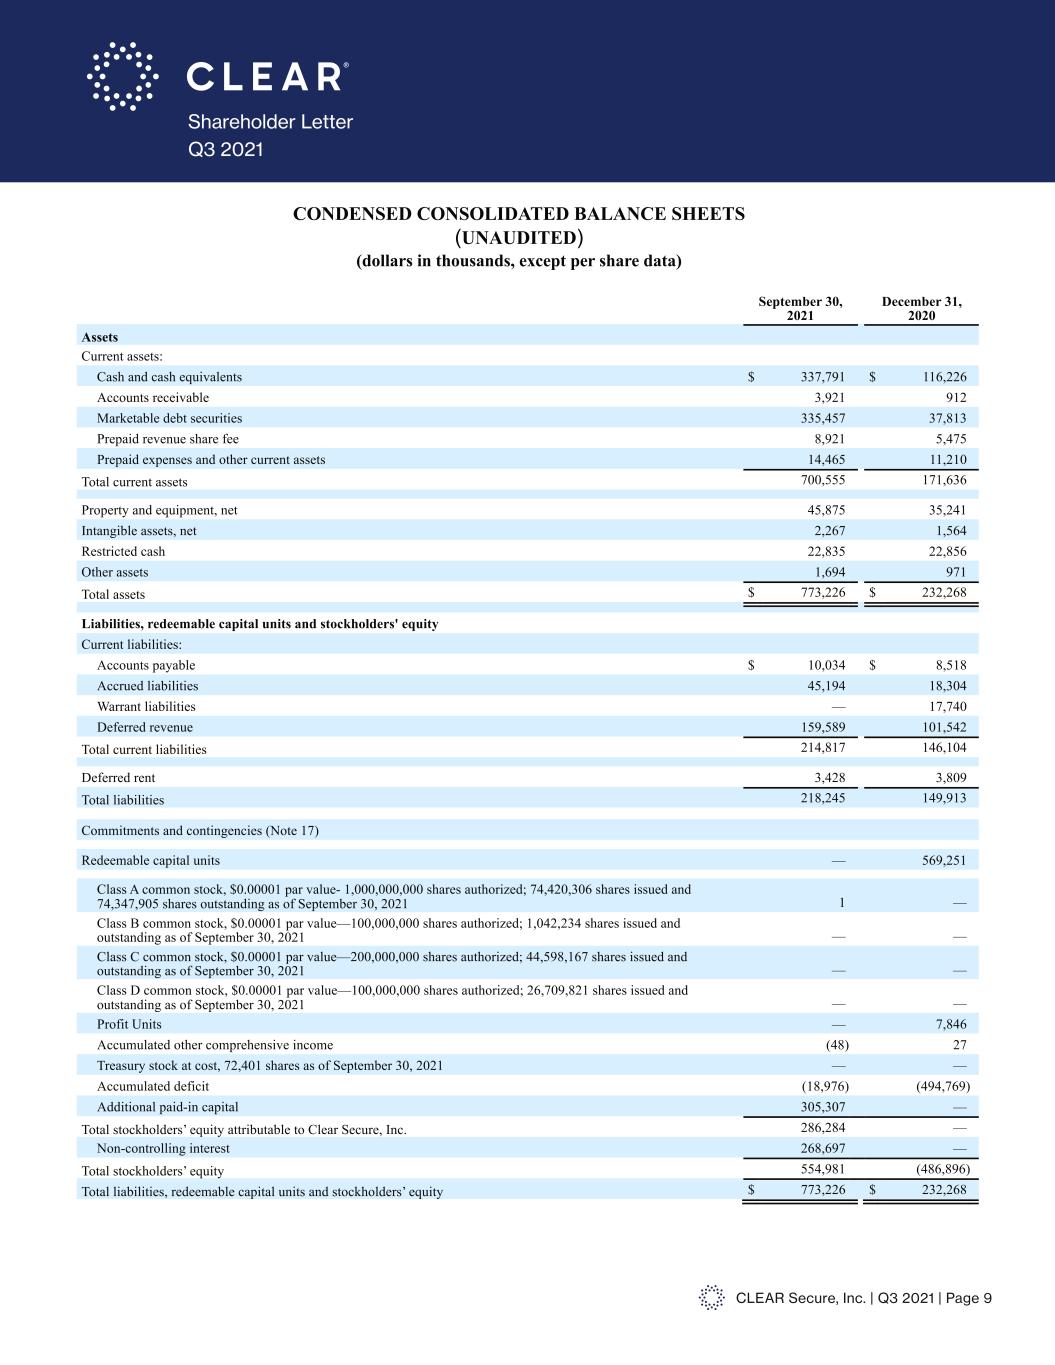
CLEAR Secure, Inc. | Q3 2021 | Page 9 Shareholder Letter Q3 2021 CLEAR SECURE, INC. CONDENSED CONSOLIDATED BALANCE SHEETS (UNAUDITED) (dollars in thousands, except per share data) September 30, 2021 December 31, 2020 Assets Current assets: Cash and cash equivalents $ 337,791 $ 116,226 Accounts receivable 3,921 912 Marketable debt securities 335,457 37,813 Prepaid revenue share fee 8,921 5,475 Prepaid expenses and other current assets 14,465 11,210 Total current assets 700,555 171,636 Property and equipment, net 45,875 35,241 Intangible assets, net 2,267 1,564 Restricted cash 22,835 22,856 Other assets 1,694 971 Total assets $ 773,226 $ 232,268 Liabilities, redeemable capital units and stockholders' equity Current liabilities: Accounts payable $ 10,034 $ 8,518 Accrued liabilities 45,194 18,304 Warrant liabilities — 17,740 Deferred revenue 159,589 101,542 Total current liabilities 214,817 146,104 Deferred rent 3,428 3,809 Total liabilities 218,245 149,913 Commitments and contingencies (Note 17) Redeemable capital units — 569,251 Class A common stock, $0.00001 par value- 1,000,000,000 shares authorized; 74,420,306 shares issued and 74,347,905 shares outstanding as of September 30, 2021 1 — Class B common stock, $0.00001 par value—100,000,000 shares authorized; 1,042,234 shares issued and outstanding as of September 30, 2021 — — Class C common stock, $0.00001 par value—200,000,000 shares authorized; 44,598,167 shares issued and outstanding as of September 30, 2021 — — Class D common stock, $0.00001 par value—100,000,000 shares authorized; 26,709,821 shares issued and outstanding as of September 30, 2021 — — Profit Units — 7,846 Accumulated other comprehensive income (48) 27 Treasury stock at cost, 72,401 shares as of September 30, 2021 — — Accumulated deficit (18,976) (494,769) Additional paid-in capital 305,307 — Total stockholders’ equity attributable to Clear Secure, Inc. 286,284 — Non-controlling interest 268,697 — Total stockholders’ equity 554,981 (486,896) Total liabilities, redeemable capital units and stockholders’ equity $ 773,226 $ 232,268
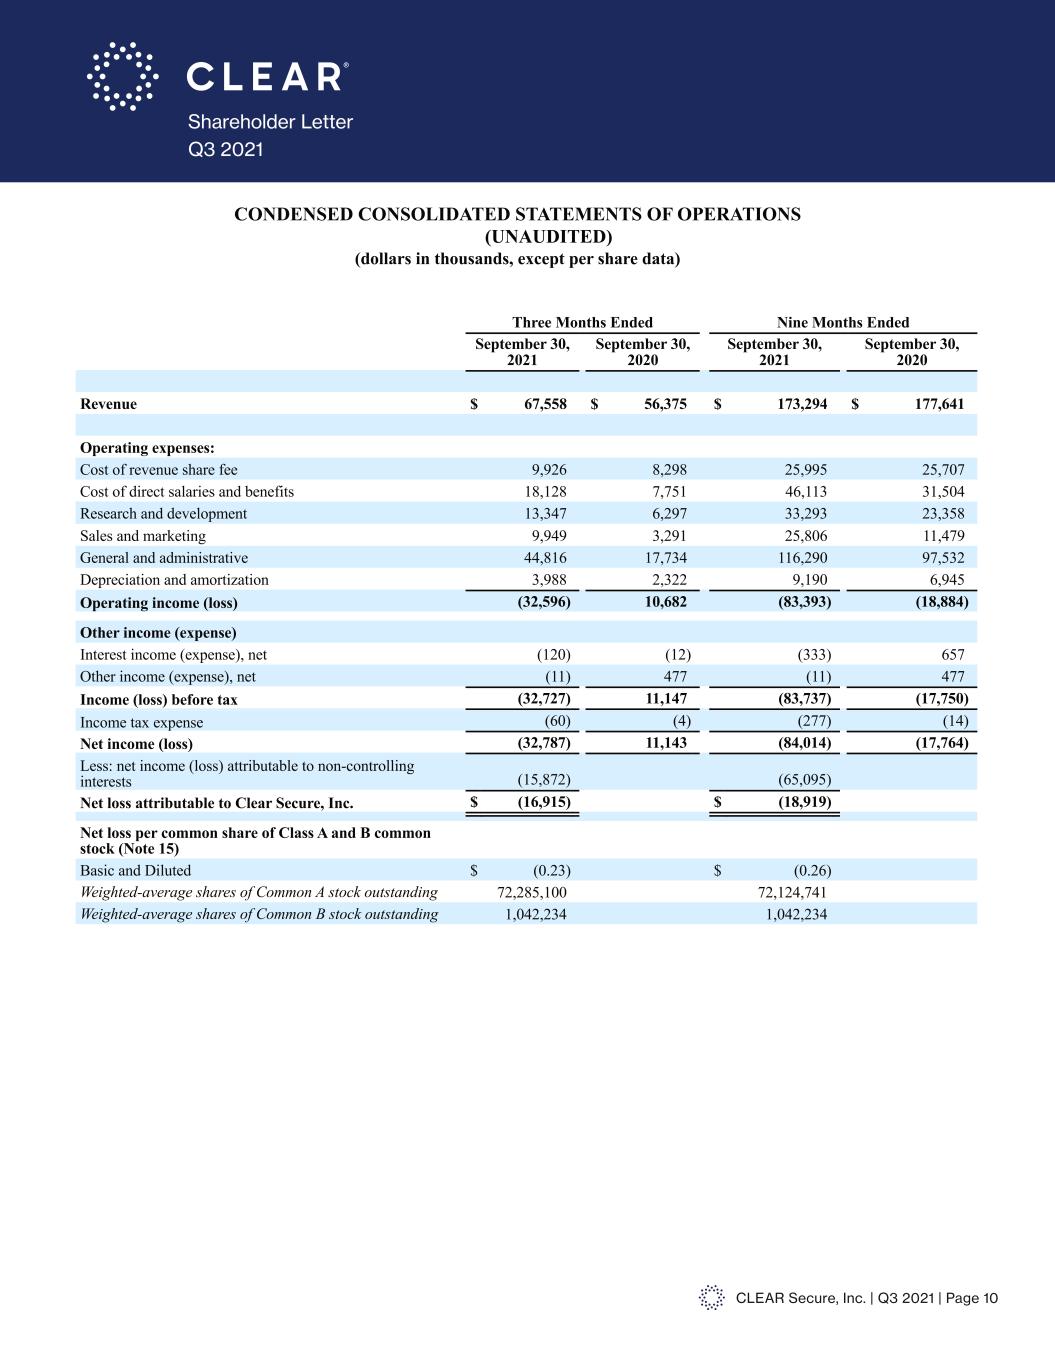
CLEAR Secure, Inc. | Q3 2021 | Page 10 Shareholder Letter Q3 2021 Table of Contents CLEAR SECURE, INC. CONDENSED CONSOLIDATED STATEMENTS OF OPERATIONS (UNAUDITED) (dollars in thousands, except per share data) Three Months Ended Nine Months Ended September 30, 2021 September 30, 2020 September 30, 2021 September 30, 2020 Revenue $ 67,558 $ 56,375 $ 173,294 $ 177,641 Operating expenses: Cost of revenue share fee 9,926 8,298 25,995 25,707 Cost of direct salaries and benefits 18,128 7,751 46,113 31,504 Research and development 13,347 6,297 33,293 23,358 Sales and marketing 9,949 3,291 25,806 11,479 General and administrative 44,816 17,734 116,290 97,532 Depreciation and amortization 3,988 2,322 9,190 6,945 Operating income (loss) (32,596) 10,682 (83,393) (18,884) Other income (expense) Interest income (expense), net (120) (12) (333) 657 Other income (expense), net (11) 477 (11) 477 Income (loss) before tax (32,727) 11,147 (83,737) (17,750) Income tax expense (60) (4) (277) (14) Net income (loss) (32,787) 11,143 (84,014) (17,764) Less: net income (loss) attributable to non-controlling interests (15,872) (65,095) Net loss attributable to Clear Secure, Inc. $ (16,915) $ (18,919) Net loss per common share of Class A and B common stock (Note 15) Basic and Diluted $ (0.23) $ (0.26) Weighted-average shares of Common A stock outstanding 72,285,100 72,124,741 Weighted-average shares of Common B stock outstanding 1,042,234 1,042,234
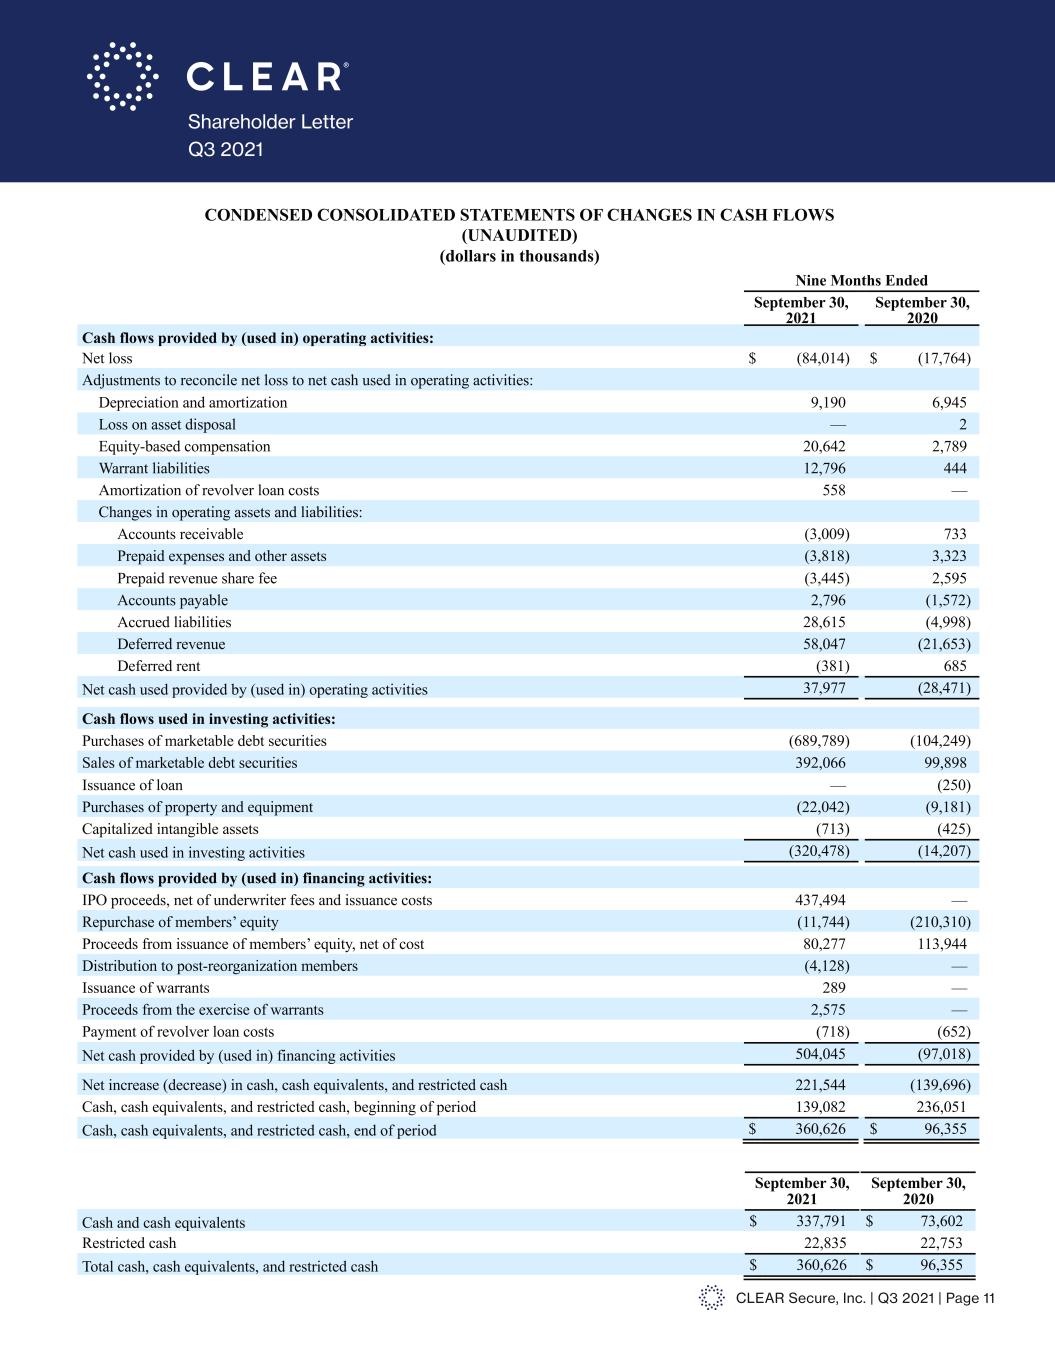
CLEAR Secure, Inc. | Q3 2021 | Page 11 Shareholder Letter Q3 2021 Table of Contents CLEAR SECURE, INC. CONDENSED CONSOLIDATED STATEMENTS OF CHANGES IN CASH FLOWS (UNAUDITED) (dollars in thousands) Nine Months Ended September 30, 2021 September 30, 2020 Cash flows provided by (used in) operating activities: Net loss $ (84,014) $ (17,764) Adjustments to reconcile net loss to net cash used in operating activities: Depreciation and amortization 9,190 6,945 Loss on asset disposal — 2 Equity-based compensation 20,642 2,789 Warrant liabilities 12,796 444 Amortization of revolver loan costs 558 — Changes in operating assets and liabilities: Accounts receivable (3,009) 733 Prepaid expenses and other assets (3,818) 3,323 Prepaid revenue share fee (3,445) 2,595 Accounts payable 2,796 (1,572) Accrued liabilities 28,615 (4,998) Deferred revenue 58,047 (21,653) Deferred rent (381) 685 Net cash used provided by (used in) operating activities 37,977 (28,471) Cash flows used in investing activities: Purchases of marketable debt securities (689,789) (104,249) Sales of marketable debt securities 392,066 99,898 Issuance of loan — (250) Purchases of property and equipment (22,042) (9,181) Capitalized intangible assets (713) (425) Net cash used in investing activities (320,478) (14,207) Cash flows provided by (used in) financing activities: IPO proceeds, net of underwriter fees and issuance costs 437,494 — Repurchase of members’ equity (11,744) (210,310) Proceeds from issuance of members’ equity, net of cost 80,277 113,944 Distribution to post-reorganization members (4,128) — Issuance of warrants 289 — Proceeds from the exercise of warrants 2,575 — Payment of revolver loan costs (718) (652) Net cash provided by (used in) financing activities 504,045 (97,018) Net increase (decrease) in cash, cash equivalents, and restricted cash 221,544 (139,696) Cash, cash equivalents, and restricted cash, beginning of period 139,082 236,051 Cash, cash equivalents, and restricted cash, end of period $ 360,626 $ 96,355 September 30, 2021 September 30, 2020 Cash and cash equivalents $ 337,791 $ 73,602 Restricted cash 22,835 22,753 Total cash, cash equivalents, and restricted cash $ 360,626 $ 96,355
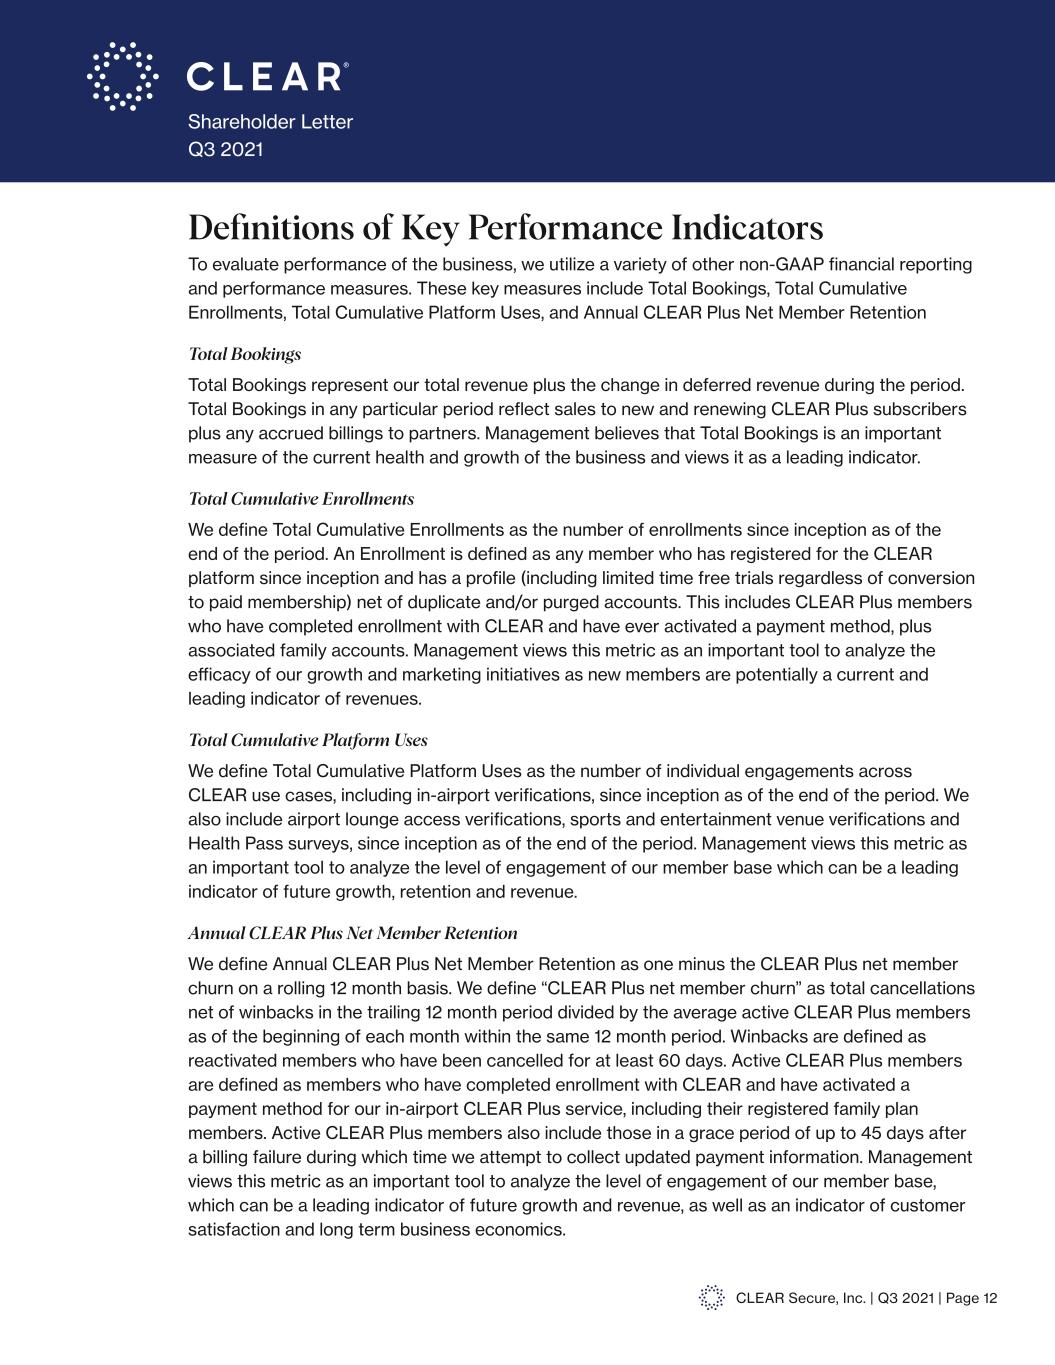
CLEAR Secure, Inc. | Q3 2021 | Page 12 Shareholder Letter Q3 2021 Definitions of Key Performance Indicators To evaluate performance of the business, we utilize a variety of other non-GAAP financial reporting and performance measures. These key measures include Total Bookings, Total Cumulative Enrollments, Total Cumulative Platform Uses, and Annual CLEAR Plus Net Member Retention Total Bookings Total Bookings represent our total revenue plus the change in deferred revenue during the period. Total Bookings in any particular period reflect sales to new and renewing CLEAR Plus subscribers plus any accrued billings to partners. Management believes that Total Bookings is an important measure of the current health and growth of the business and views it as a leading indicator. Total Cumulative Enrollments We define Total Cumulative Enrollments as the number of enrollments since inception as of the end of the period. An Enrollment is defined as any member who has registered for the CLEAR platform since inception and has a profile (including limited time free trials regardless of conversion to paid membership) net of duplicate and/or purged accounts. This includes CLEAR Plus members who have completed enrollment with CLEAR and have ever activated a payment method, plus associated family accounts. Management views this metric as an important tool to analyze the efficacy of our growth and marketing initiatives as new members are potentially a current and leading indicator of revenues. Total Cumulative Platform Uses We define Total Cumulative Platform Uses as the number of individual engagements across CLEAR use cases, including in-airport verifications, since inception as of the end of the period. We also include airport lounge access verifications, sports and entertainment venue verifications and Health Pass surveys, since inception as of the end of the period. Management views this metric as an important tool to analyze the level of engagement of our member base which can be a leading indicator of future growth, retention and revenue. Annual CLEAR Plus Net Member Retention We define Annual CLEAR Plus Net Member Retention as one minus the CLEAR Plus net member churn on a rolling 12 month basis. We define “CLEAR Plus net member churn” as total cancellations net of winbacks in the trailing 12 month period divided by the average active CLEAR Plus members as of the beginning of each month within the same 12 month period. Winbacks are defined as reactivated members who have been cancelled for at least 60 days. Active CLEAR Plus members are defined as members who have completed enrollment with CLEAR and have activated a payment method for our in-airport CLEAR Plus service, including their registered family plan members. Active CLEAR Plus members also include those in a grace period of up to 45 days after a billing failure during which time we attempt to collect updated payment information. Management views this metric as an important tool to analyze the level of engagement of our member base, which can be a leading indicator of future growth and revenue, as well as an indicator of customer satisfaction and long term business economics.
CLEAR Secure, Inc. | Q3 2021 | Page 13 Shareholder Letter Q3 2021 Non-GAAP Financial Measures In addition to our results as determined in accordance with GAAP, we disclose Adjusted EBITDA and Free Cash Flow as non-GAAP financial measures that management believes provide useful information to investors. These measures are not financial measures calculated in accordance with GAAP and should not be considered as a substitute for net income (loss), or any other operating performance measure calculated in accordance with GAAP, and may not be comparable to a similarly titled measure reported by other companies. The amounts below are expressed in thousands. Adjusted EBITDA We define Adjusted EBITDA as net income (loss) adjusted for income taxes, interest (income) expense net, depreciation and amortization, losses on asset disposals, equity-based compensation expense, mark to market of warrant liabilities and other income (expense), net. Adjusted EBITDA is an important financial measure used by management and our board of directors in determining performance-based compensation for our management and key employees. Free Cash Flow We define Free Cash Flow as net cash provided by (used in) operating activities adjusted for purchases of property and equipment plus the value of share repurchases over fair value. With regards to our CLEAR Plus subscription service, we generally collect cash from our members upfront for annual subscriptions. As a result, when the business is growing Free Cash Flow can be a real time indicator of the current trajectory of the business. See following page for reconciliations of these non-GAAP financial measures to their most comparable GAAP measures. Forward-Looking Statements This release may contain statements that constitute forward-looking statements within the meaning of the Private Securities Litigation Reform Act of 1995. Investors are cautioned that any such forward-looking statements are not guarantees of future performance or results and involve risks and uncertainties, and that actual results, developments and events may differ materially from those in the forward-looking statements as a result of various factors, including those described in the Company’s filings with the Securities and Exchange Commission, including the sections titled “Risk Factors” in our Registration Statement on Form S-1 (File No. 333-256851), as amended, and the final prospectus dated June 29, 2021. The Company disclaims any obligation to update any forward-looking statements contained herein.
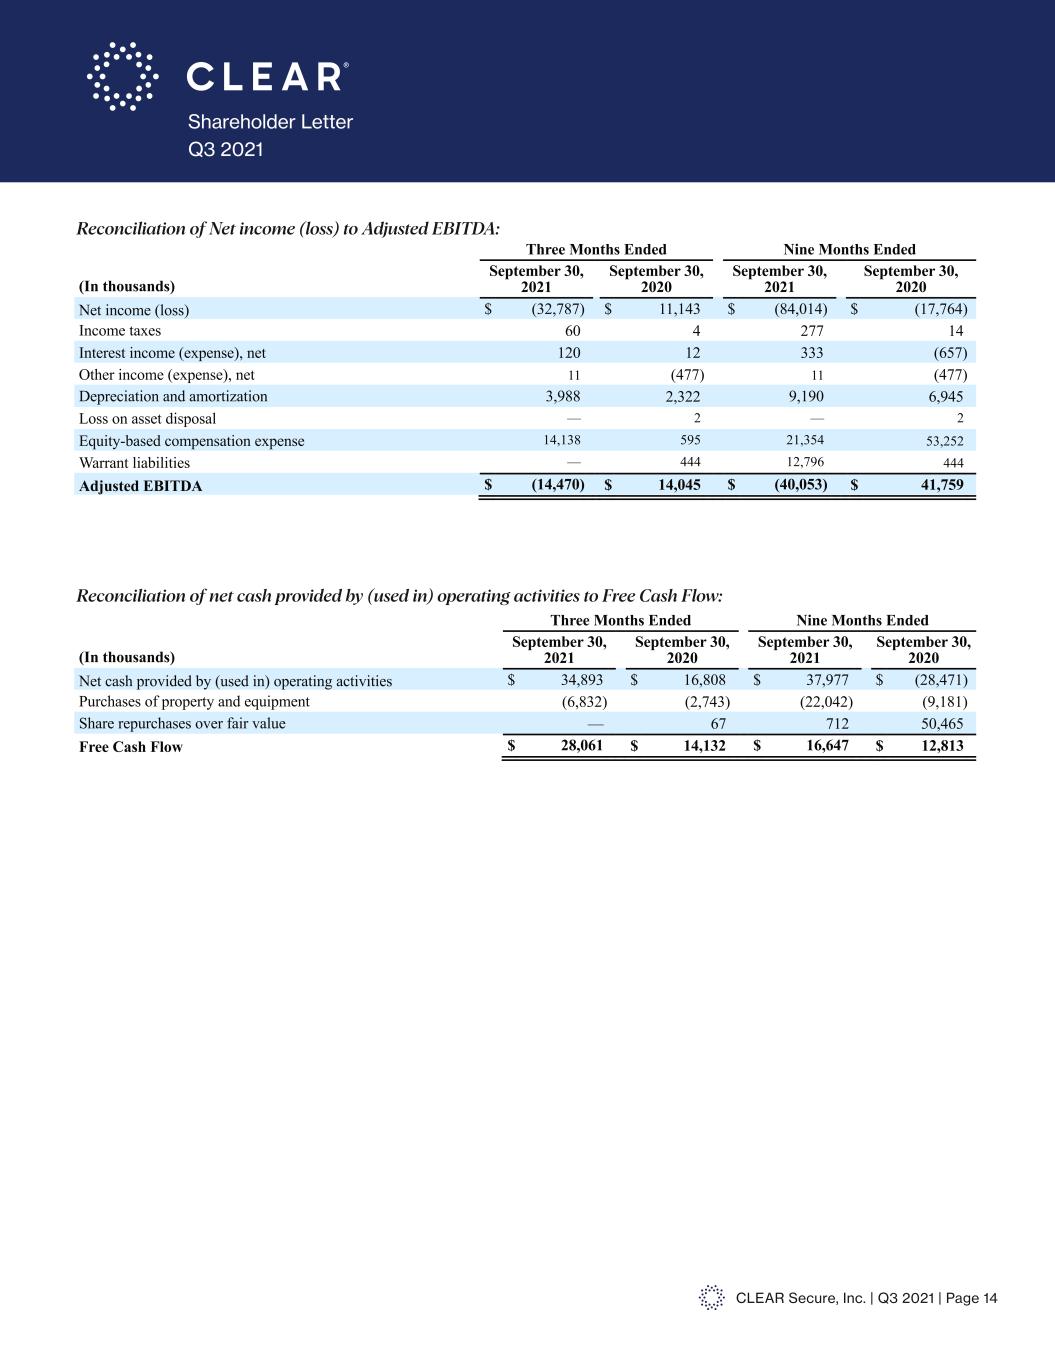
CLEAR Secure, Inc. | Q3 2021 | Page 14 Shareholder Letter Q3 2021 Table of Contents Non-GAAP Financial Measures In addition to our results as determined in accordance with GAAP, we disclose Adjusted EBITDA and Free Cash Flow as non-GAAP financial measures that management believes provide useful information to investors. These measures are not financial measures calculated in accordance with GAAP and should not be considered as a substitute for net income (loss), or any other operating performance measure calculated in accordance with GAAP, and may not be comparable to a similarly titled measure reported by other companies. The amounts below are expressed in thousands. Adjusted EBITDA We define Adjusted EBITDA as net income (loss) adjusted for income taxes, interest (income) expense net, depreciation and amortization, losses on asset disposals, equity-based compensation expense, mark to market of warrant liabilities and other income (expense), net. Adjusted EBITDA is an important financial measure used by management and our board of directors in determining performance-based compensation for our management and key employees. Free Cash Flow We define Free Cash Flow as net cash provided by (used in) operating activities adjusted for purchases of property and equipment plus the value of share repurchases over fair value. With regards to our CLEAR Plus subscription service, we generally collect cash from our members upfront for annual subscriptions. As a result, when the business is growing Free Cash Flow can be a real time indicator of the current trajectory of the business. See below for reconciliations of these non-GAAP financial measures to their most comparable GAAP measures. Reconciliation of Net income (loss) to Adjusted EBITDA: Three Months Ended Nine Months Ended (In thousands) September 30, 2021 September 30, 2020 September 30, 2021 September 30, 2020 Net income (loss) $ (32,787) $ 11,143 $ (84,014) $ (17,764) Income taxes 60 4 277 14 Interest income (expense), net 120 12 333 (657) Other income (expense), net 11 (477) 11 (477) Depreciation and amortization 3,988 2,322 9,190 6,945 Loss on asset disposal — 2 — 2 Equity-based compensation expense 14,138 595 21,354 53,252 Warrant liabilities — 444 12,796 444 Adjusted EBITDA $ (14,470) $ 14,045 $ (40,053) $ 41,759 Reconciliation of Net cash provided by (used in) operating activities to Free Cash Flow: Three Months Ended Nine Months Ended (In thousands) September 30, 2021 September 30, 2020 September 30, 2021 September 30, 2020 Net cash provided by (used in) operating activities $ 34,893 $ 16,808 $ 37,977 $ (28,471) Purchases of property and equipment (6,832) (2,743) (22,042) (9,181) Share repurchases over fair value — 67 712 50,465 Free Cash Flow $ 28,061 $ 14,132 $ 16,647 $ 12,813 Reconciliation of Net income (loss) to Adjusted EBITDA: Table of Contents Non-GAAP Financial Measures In addition to our results as determined in accordance with GAAP, we disclose Adjusted EBITDA and Free Cash Flow as non-GAAP financial measures that management believes provide useful information to investors. These measures are not financial measures calculated in accordance with GAAP and should not be considered as a substitute for net income (loss), or any other operating performance measure calculated in accordance with GAAP, and may not be comparable to a similarly titled measure reported by other companies. The amounts below are expressed in thousands. Adjusted EBITDA We define Adjusted EBITDA as net income (loss) adjusted for income taxes, interest (income) expense net, depreciation and amortization, losses on asset disposals, equity-based compensation expense, mark to market of warrant liabilities and other income (expense), net. Adjusted EBITDA is an important financial measure used by management and our board of directors in determining performance-based compensation for our management and key employees. Free Cash Flow We define Free Cash Flow as net cash provided by (used in) operating activities adjusted for purchases of property and equipment plus the value of share repurchases over fair value. With regards to our CLEAR Plus subscription service, we generally collect cash from our members upfront for annual subscriptions. As a result, when the business is growing Free Cash Flow can be a real time indicator of the current trajectory of the business. See below for reconciliations of these non-GAAP financial measures to their most comparable GAAP measures. Reconciliation of Net income (loss) to Adjusted EBITDA: Three Months Ended Nine Months Ended (In thousands) September 30, 2021 September 30, 2020 September 30, 2021 September 30, 2020 Net income (loss) $ (32,787) $ 11,143 $ (84,014) $ (17,764) Income taxes 60 4 277 14 Interest income (expense), net 120 12 333 (657) Other income (expense), net 11 (477) 11 (477) Depreciation and amortization 3,988 2,322 9,190 6,945 Loss on asset disposal — 2 — 2 Equity-based compensation expense 14,138 595 21,354 53,252 Warrant liabilities — 444 12,796 444 Adjusted EBITDA $ (14,470) $ 14,045 $ (40,053) $ 41,759 Reconciliation of Net cash provided by (used in) operating activities to Free Cash Flow: Three Months Ended Nine Months Ended (In thousands) September 30, 2021 September 30, 2020 September 30, 2021 September 30, 2020 Net cash provided by (used in) operating activities $ 34,893 $ 16,808 $ 37,977 $ (28,471) Purchases of property and equipment (6,832) (2,743) (22,042) (9,181) Share repurchases over fair value — 67 712 50,465 Free Cash Flow $ 28,061 $ 14,132 $ 16,647 $ 12,813 Reconciliation of net cash provided by (used in) operating activities to Free Cash Flow:
