Shareholder Letter Q4 2022 YUL FCO
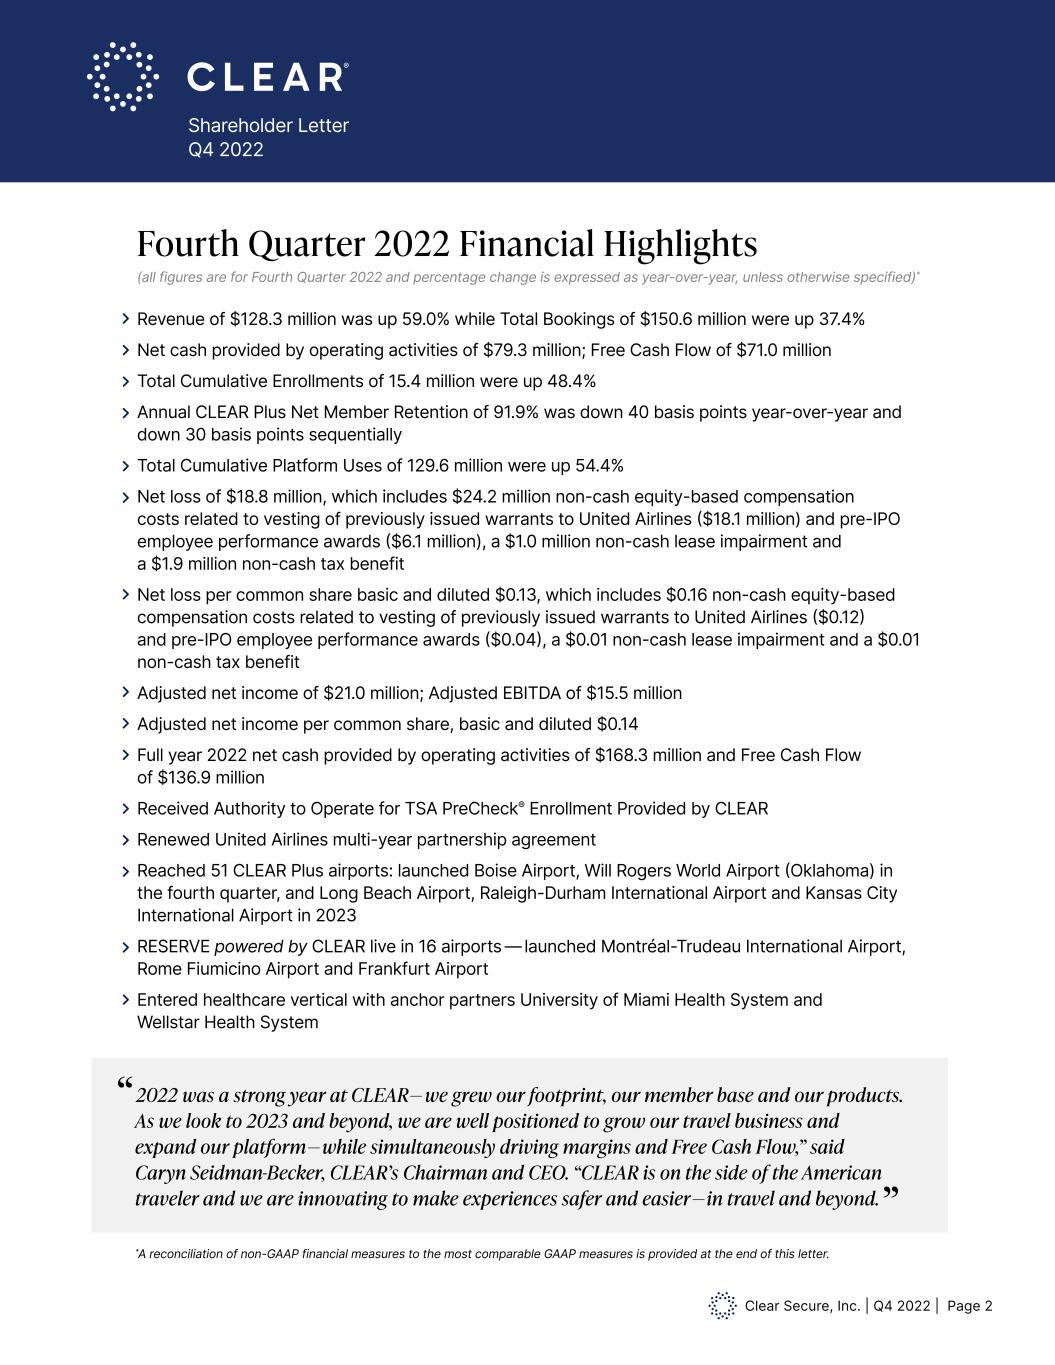
Clear Secure, Inc. | Q4 2022 | Page 2 Shareholder Letter Q4 2022 Fourth Quarter 2022 Financial Highlights (all figures are for Fourth Quarter 2022 and percentage change is expressed as year-over-year, unless otherwise specified)* Revenue of $128.3 million was up 59.0% while Total Bookings of $150.6 million were up 37.4% Net cash provided by operating activities of $79.3 million; Free Cash Flow of $71.0 million Total Cumulative Enrollments of 15.4 million were up 48.4% Annual CLEAR Plus Net Member Retention of 91.9% was down 40 basis points year-over-year and down 30 basis points sequentially Total Cumulative Platform Uses of 129.6 million were up 54.4% Net loss of $18.8 million, which includes $24.2 million non-cash equity-based compensation costs related to vesting of previously issued warrants to United Airlines ($18.1 million) and pre-IPO employee performance awards ($6.1 million), a $1.0 million non-cash lease impairment and a $1.9 million non-cash tax benefit Net loss per common share basic and diluted $0.13, which includes $0.16 non-cash equity-based compensation costs related to vesting of previously issued warrants to United Airlines ($0.12) and pre-IPO employee performance awards ($0.04), a $0.01 non-cash lease impairment and a $0.01 non-cash tax benefit Adjusted net income of $21.0 million; Adjusted EBITDA of $15.5 million Adjusted net income per common share, basic and diluted $0.14 Full year 2022 net cash provided by operating activities of $168.3 million and Free Cash Flow of $136.9 million Received Authority to Operate for TSA PreCheck® Enrollment Provided by CLEAR Renewed United Airlines multi-year partnership agreement Reached 51 CLEAR Plus airports: launched Boise Airport, Will Rogers World Airport (Oklahoma) in the fourth quarter, and Long Beach Airport, Raleigh-Durham International Airport and Kansas City International Airport in 2023 RESERVE powered by CLEAR live in 16 airports—launched Montréal-Trudeau International Airport, Rome Fiumicino Airport and Frankfurt Airport Entered healthcare vertical with anchor partners University of Miami Health System and Wellstar Health System * A reconciliation of non-GAAP financial measures to the most comparable GAAP measures is provided at the end of this letter. “ 2022 was a strong year at CLEAR— we grew our footprint, our member base and our products. As we look to 2023 and beyond, we are well positioned to grow our travel business and expand our platform— while simultaneously driving margins and Free Cash Flow,” said Caryn Seidman-Becker, CLEAR’s Chairman and CEO. “CLEAR is on the side of the American traveler and we are innovating to make experiences safer and easier — in travel and beyond.” *A reconciliation of non-GAAP financial measures to the most comparable GAAP measures is provided at the end of this letter.
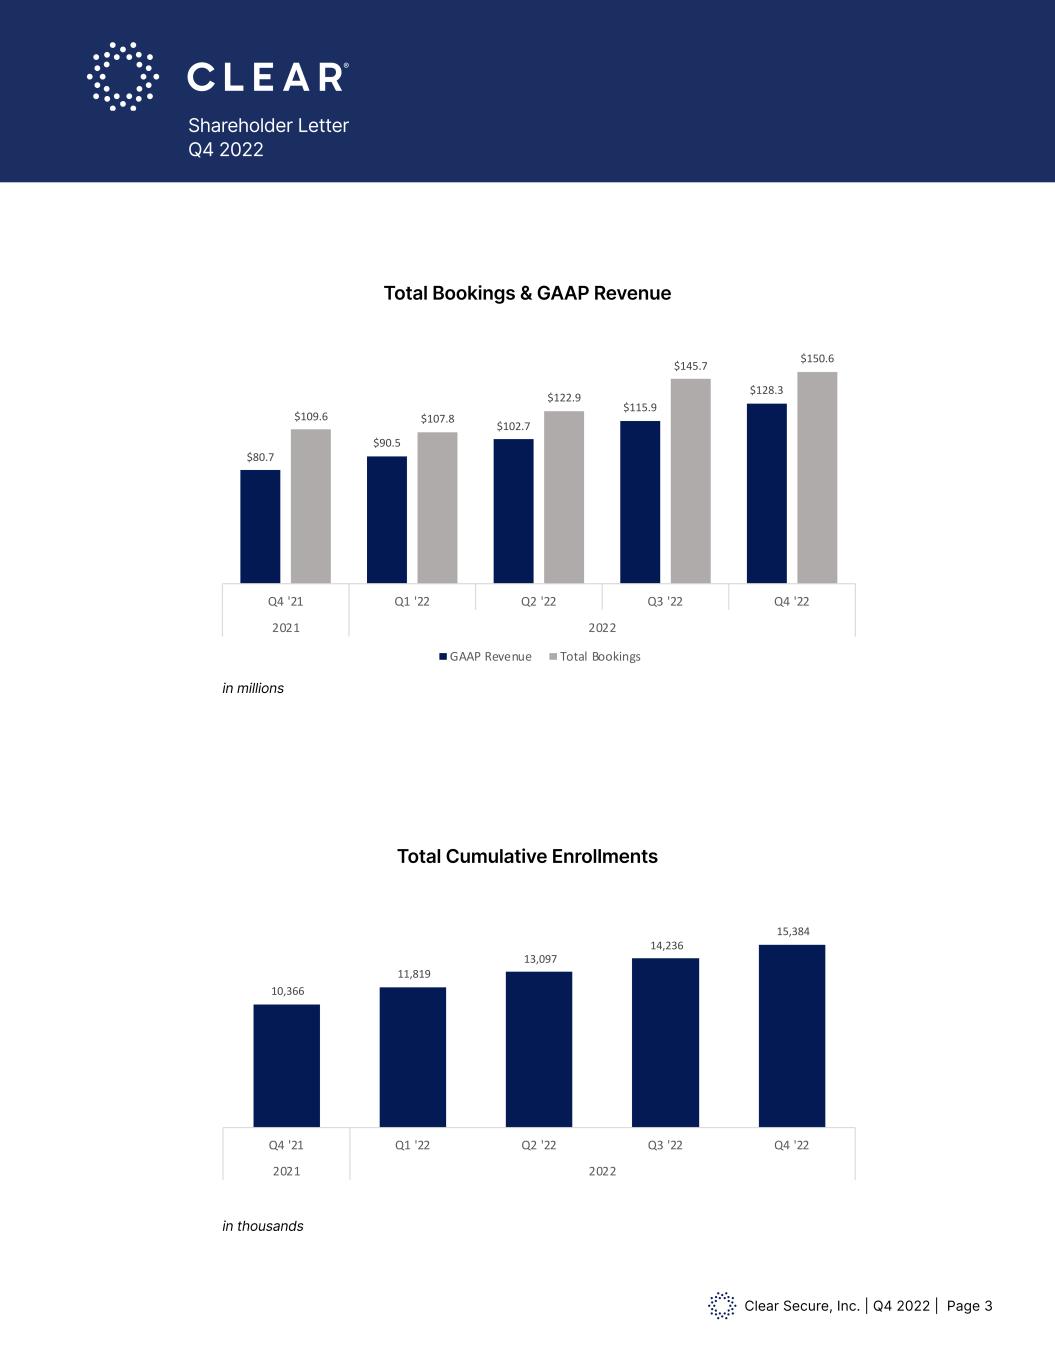
Clear Secure, Inc. | Q4 2022 | Page 3 Shareholder Letter Q4 2022 10,366 11,819 13,097 14,236 15,384 Q4 '21 Q1 '22 Q2 '22 Q3 '22 Q4 '22 2021 2022 Total Cumulative Enrollments in millions Total Bookings & GAAP Revenue Total Cumulative Enrollments in thousands $80.7 $90.5 $102.7 $115.9 $128.3 $109.6 $107.8 $122.9 $145.7 $150.6 Q4 '21 Q1 '22 Q2 '22 Q3 '22 Q4 '22 2021 2022 Total Bookings & GAAP Revenue GAAP Revenue Total Bookings
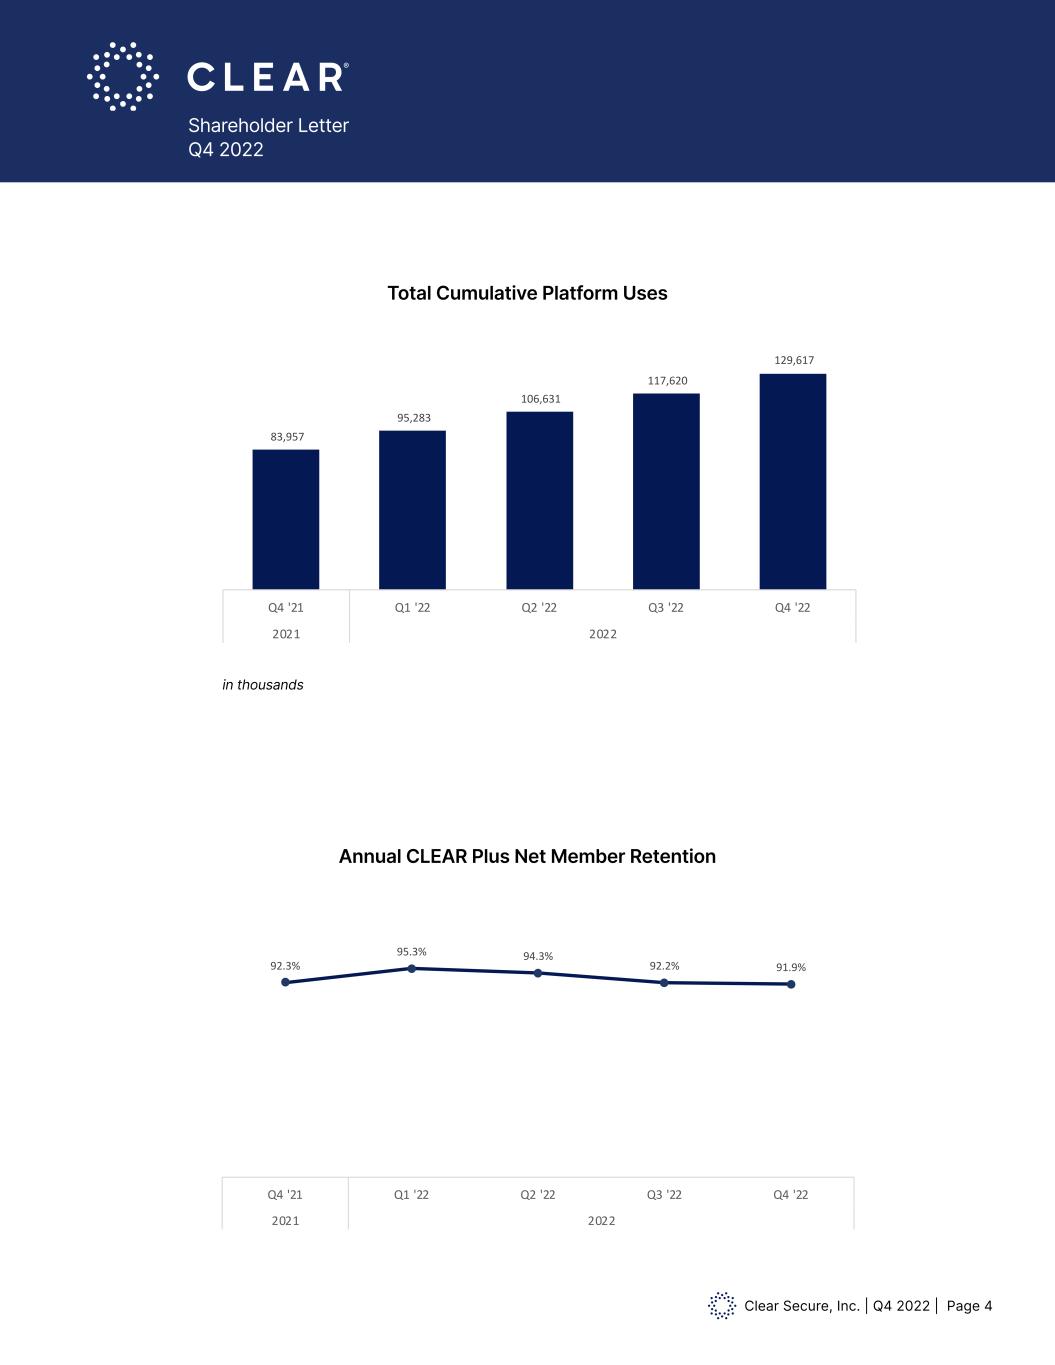
Clear Secure, Inc. | Q4 2022 | Page 4 Shareholder Letter Q4 2022 Total Cumulative Platform Uses Annual CLEAR Plus Net Member Retention in thousands 83,957 95,283 106,631 117,620 129,617 Q4 '21 Q1 '22 Q2 '22 Q3 '22 Q4 '22 2021 2022 Total Cumulative Platform Uses 92.3% 95.3% 94.3% 92.2% 91.9% Q4 '21 Q1 '22 Q2 '22 Q3 '22 Q4 '22 2021 2022 Annual CLEAR Plus Member Retention
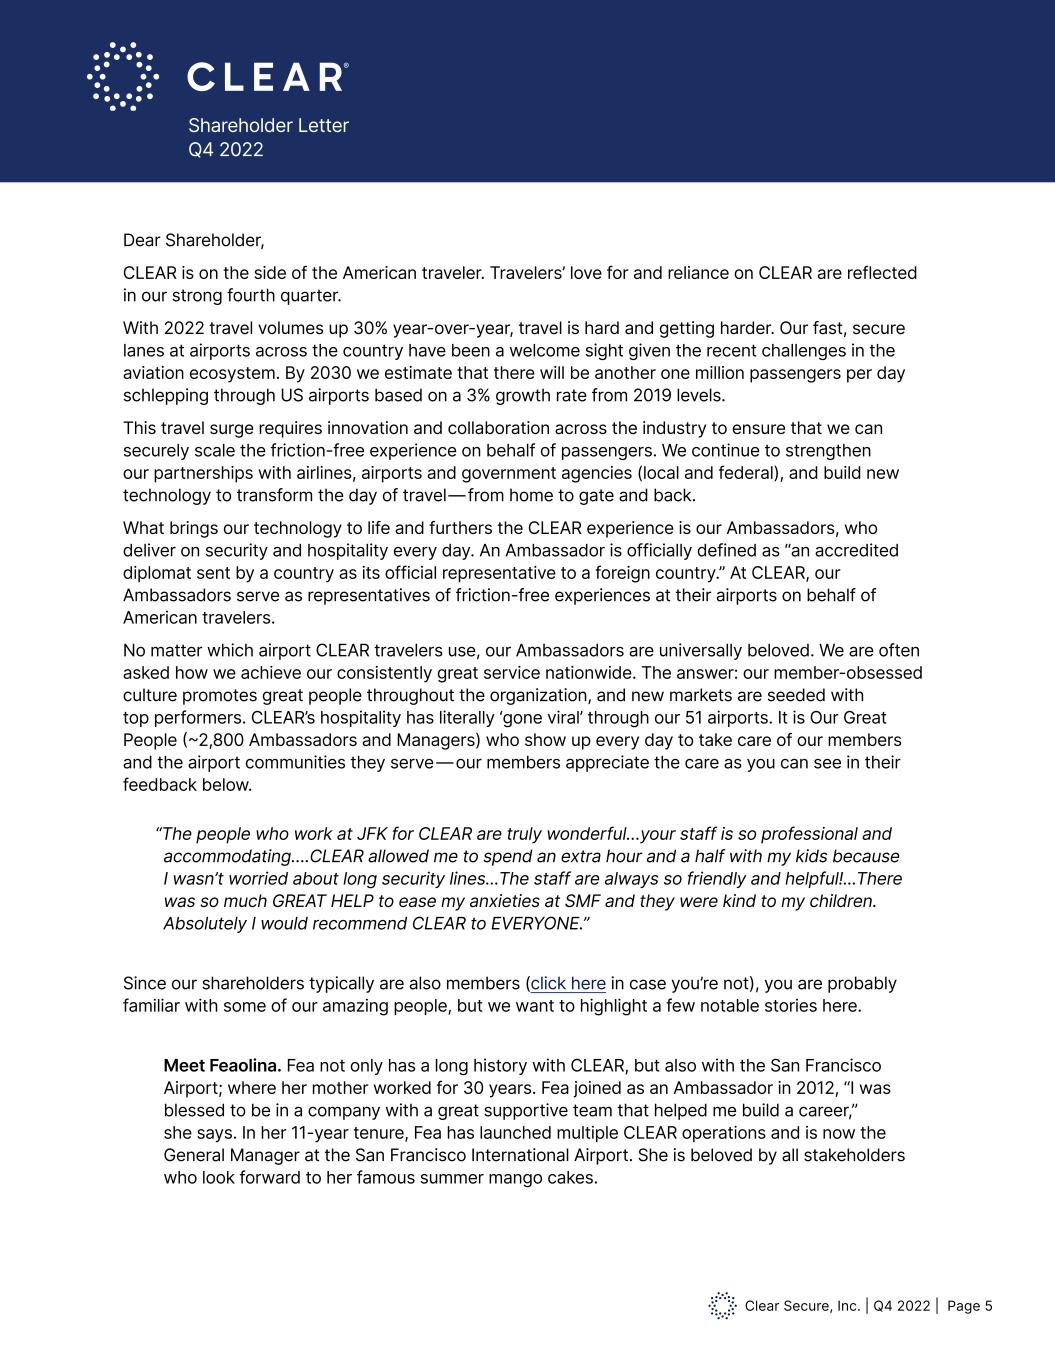
Clear Secure, Inc. | Q4 2022 | Page 5 Shareholder Letter Q4 2022 Dear Shareholder, CLEAR is on the side of the American traveler. Travelers’ love for and reliance on CLEAR are reflected in our strong fourth quarter. With 2022 travel volumes up 30% year-over-year, travel is hard and getting harder. Our fast, secure lanes at airports across the country have been a welcome sight given the recent challenges in the aviation ecosystem. By 2030 we estimate that there will be another one million passengers per day schlepping through US airports based on a 3% growth rate from 2019 levels. This travel surge requires innovation and collaboration across the industry to ensure that we can securely scale the friction-free experience on behalf of passengers. We continue to strengthen our partnerships with airlines, airports and government agencies (local and federal), and build new technology to transform the day of travel—from home to gate and back. What brings our technology to life and furthers the CLEAR experience is our Ambassadors, who deliver on security and hospitality every day. An Ambassador is officially defined as “an accredited diplomat sent by a country as its official representative to a foreign country.” At CLEAR, our Ambassadors serve as representatives of friction-free experiences at their airports on behalf of American travelers. No matter which airport CLEAR travelers use, our Ambassadors are universally beloved. We are often asked how we achieve our consistently great service nationwide. The answer: our member-obsessed culture promotes great people throughout the organization, and new markets are seeded with top performers. CLEAR’s hospitality has literally ‘gone viral’ through our 51 airports. It is Our Great People (~2,800 Ambassadors and Managers) who show up every day to take care of our members and the airport communities they serve—our members appreciate the care as you can see in their feedback below. “The people who work at JFK for CLEAR are truly wonderful…your staff is so professional and accommodating….CLEAR allowed me to spend an extra hour and a half with my kids because I wasn’t worried about long security lines...The staff are always so friendly and helpful!...There was so much GREAT HELP to ease my anxieties at SMF and they were kind to my children. Absolutely I would recommend CLEAR to EVERYONE.” Meet Feaolina. Fea not only has a long history with CLEAR, but also with the San Francisco Airport; where her mother worked for 30 years. Fea joined as an Ambassador in 2012, “I was blessed to be in a company with a great supportive team that helped me build a career,” she says. In her 11-year tenure, Fea has launched multiple CLEAR operations and is now the General Manager at the San Francisco International Airport. She is beloved by all stakeholders who look forward to her famous summer mango cakes. Since our shareholders typically are also members (click here in case you’re not), you are probably familiar with some of our amazing people, but we want to highlight a few notable stories here.
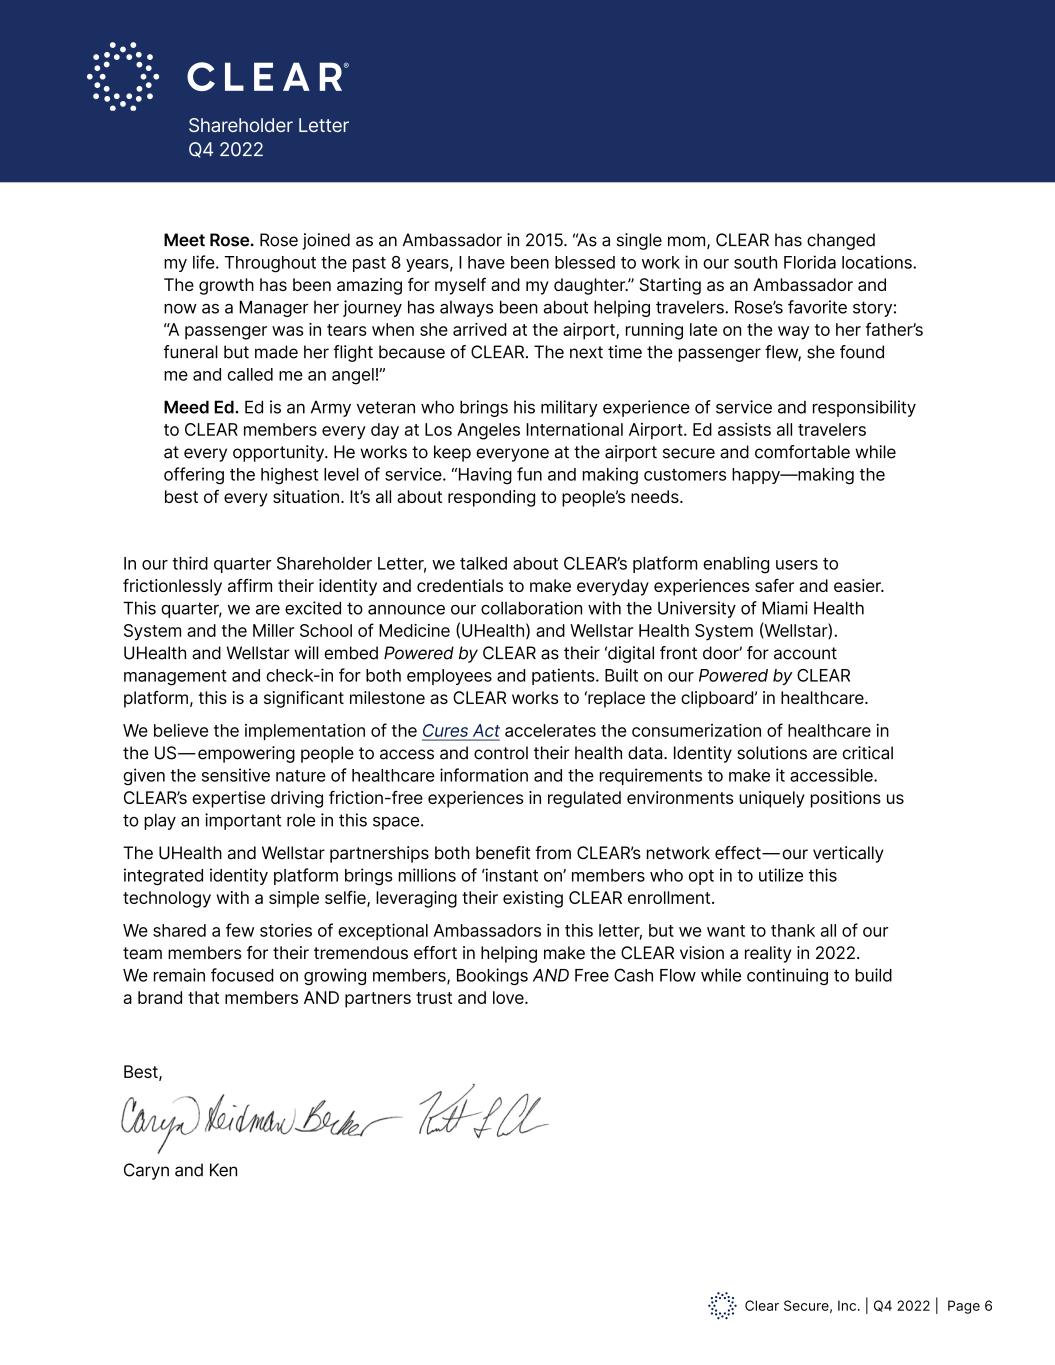
Clear Secure, Inc. | Q4 2022 | Page 6 Shareholder Letter Q4 2022 In our third quarter Shareholder Letter, we talked about CLEAR’s platform enabling users to frictionlessly affirm their identity and credentials to make everyday experiences safer and easier. This quarter, we are excited to announce our collaboration with the University of Miami Health System and the Miller School of Medicine (UHealth) and Wellstar Health System (Wellstar). UHealth and Wellstar will embed Powered by CLEAR as their ‘digital front door’ for account management and check-in for both employees and patients. Built on our Powered by CLEAR platform, this is a significant milestone as CLEAR works to ‘replace the clipboard’ in healthcare. We believe the implementation of the Cures Act accelerates the consumerization of healthcare in the US—empowering people to access and control their health data. Identity solutions are critical given the sensitive nature of healthcare information and the requirements to make it accessible. CLEAR’s expertise driving friction-free experiences in regulated environments uniquely positions us to play an important role in this space. The UHealth and Wellstar partnerships both benefit from CLEAR’s network effect—our vertically integrated identity platform brings millions of ‘instant on’ members who opt in to utilize this technology with a simple selfie, leveraging their existing CLEAR enrollment. We shared a few stories of exceptional Ambassadors in this letter, but we want to thank all of our team members for their tremendous effort in helping make the CLEAR vision a reality in 2022. We remain focused on growing members, Bookings AND Free Cash Flow while continuing to build a brand that members AND partners trust and love. Best, Caryn and Ken Meet Rose. Rose joined as an Ambassador in 2015. “As a single mom, CLEAR has changed my life. Throughout the past 8 years, I have been blessed to work in our south Florida locations. The growth has been amazing for myself and my daughter.” Starting as an Ambassador and now as a Manager her journey has always been about helping travelers. Rose’s favorite story: “A passenger was in tears when she arrived at the airport, running late on the way to her father’s funeral but made her flight because of CLEAR. The next time the passenger flew, she found me and called me an angel!” Meed Ed. Ed is an Army veteran who brings his military experience of service and responsibility to CLEAR members every day at Los Angeles International Airport. Ed assists all travelers at every opportunity. He works to keep everyone at the airport secure and comfortable while offering the highest level of service. “Having fun and making customers happy—making the best of every situation. It’s all about responding to people’s needs.
Clear Secure, Inc. | Q4 2022 | Page 7 Shareholder Letter Q4 2022 Fourth Quarter 2022 Financial Discussion Fourth quarter 2022 revenue of $128.3 million grew 59.0% as compared to the fourth quarter of 2021 while Total Bookings of $150.6 million grew 37.4%. We saw a continuation of the strong travel trends experienced in the third quarter 2022 driving both membership growth and net retention, leading to better than expected Total Bookings growth. Our in-airport and partner channels continued to perform well. Additionally we signed and booked several new platform deals. Fourth quarter 2022 Total Cumulative Enrollments reached 15.4 million, driven primarily by an increase in CLEAR Plus enrollments. Fourth quarter 2022 Total Cumulative Platform Uses reached 129.6 million, driven by the continued strength in air travel leading to increases in CLEAR Plus verifications. Fourth quarter 2022 Annual CLEAR Plus Net Member Retention was 91.9%, down 40 basis points year-over-year and down 30 basis points sequentially. This performance was driven by strength in gross renewals offset by a year-over-year decrease in winbacks of previously canceled members. As previously discussed, we expect long-term Annual CLEAR Plus Net Member Retention to settle in the upper 80s percentage range, above pre-pandemic levels. Cost of revenue share fee was $17.1 million in the fourth quarter of 2022 and includes a non-recurring benefit of $1.2 million. Cost of revenue share fee was 13.3% of revenue, down 59 basis points year-over-year and up 59 basis points sequentially. Cost of direct salaries and benefits were $29.6 million in the fourth quarter of 2022, up 36.8% year-over-year, and up 9.9% sequentially. As a percentage of revenue, cost of direct salaries and benefits were down 374 basis points year-over-year and 16 basis points sequentially. Sequential growth of $2.7 million was elevated by approximately $0.9 million related to new airports opened in the fourth quarter and first quarter of 2023. Research and development expense of $20.4 million in the fourth quarter of 2022 includes $7.2 million of non-cash equity-based compensation cost, of which $2.6 million relates to pre-IPO employee performance awards. Excluding the pre-IPO employee performance awards expense, research and development expense was up 25.9% year-over-year and up 8.3% sequentially and as a percentage of revenue it was down 366 basis points year-over-year and 30 basis points sequentially. Sales and marketing expense of $12.0 million in the fourth quarter of 2022 includes $0.2 million of pre-IPO employee performance awards. Excluding the pre-IPO employee performance awards, sales and marketing expense grew 25.4% year-over-year and 11.8% sequentially and as a percentage of revenue it was down 246 basis points year-over-year and up 10 basis points sequentially. Sales and marketing expense reflects opportunistic investments in performance based marketing initiatives, in-lane giveaways and a holiday brand campaign. General and administrative expense of $75.7 million in the fourth quarter of 2022 includes $32.2 million of non-cash equity-based compensation cost, of which $18.1 million is related to the vesting of warrants issued pre-IPO to United Airlines and $3.3 million relates to pre-IPO employee performance awards. In addition, the current period includes a $1.0 million non-cash lease impairment. The prior year period includes $1.4 million of acquisition related fees and expenses and $1.4 million
Clear Secure, Inc. | Q4 2022 | Page 8 Shareholder Letter Q4 2022 Fourth Quarter 2022 Financial Discussion (Cont.) of non-cash equity-based compensation cost related to the vesting of warrants issued pre-IPO to United Airlines. Excluding the United Airlines non-cash equity-based compensation cost, pre-IPO employee performance awards expense, the impairment and acquisition related fees and expenses, general and administrative expense of $53.3 million grew 6.9% percent year-over-year and 7.5% sequentially and as a percentage of revenue it was down 2,024 basis points year-over-year and 122 basis points sequentially. Equity-based compensation expense of $40.0 million in the fourth quarter of 2022 includes the following: (1) $18.1 million of cost relating to the vesting of warrants issued pre-IPO to United Airlines (of which $3.5 million relates to the remaining portion from warrants vested in the fourth quarter of 2022 and $14.5 million is the expense for the final tranche of performance based warrants for 534,655 shares of Class A Common Stock which vested in first quarter of 2023 upon the renewal of our partnership) and (2) $6.1 million of non-cash compensation expense relating to 616,932 pre-IPO employee performance awards (which, based on actual and expected 2021-2023 cumulative results, management now expects to vest in 2024). Excluding the United Airlines warrant expense and the pre-IPO employee performance awards expense, equity-based compensation expense of $15.8 million was up 9.1% year-over-year and 11.0% sequentially. Of the $15.8 million, $9.2 million relates to non-founder employee equity-based compensation expense and $6.6 million relates to the Founders’ Post-IPO Performance Awards (“Founder PSUs”) as detailed in our Final Prospectus, dated June 29, 2021. The Founder PSUs are eligible to vest over a five-year period based on the achievement of pre-determined stock price goals ranging from $46.50 to $93 during measurement periods beginning June 2023 and ending June 2026. The Founder PSUs will be expensed through June 29, 2025 regardless of vesting probability. Fourth quarter 2022 net loss was $18.8 million, net loss per common share basic and diluted was $0.13. Excluding the non-cash equity-based compensation cost of $18.1 million related to the United Airlines warrants and $6.1 million related to the pre-IPO employee performance awards, the $1.0 million non-cash impairment and a $1.9 million non-cash tax benefit, net income was $4.6 million and net income per common share basic was $0.03. Fourth quarter 2022 adjusted net income was $21.0 million, adjusted net income per common share, basic and diluted was $0.14. Fourth quarter 2022 net cash provided by operating activities was $79.3 million, Free Cash Flow was $71.0 million and Adjusted EBITDA was $15.5 million. Because of CLEAR Plus revenue recognition policies, when Total Bookings are growing, net cash provided by operating activities and Free Cash Flow may exceed Adjusted EBITDA and net income. As of December 31, 2022, our cash and cash equivalents, including marketable securities and restricted cash were $734.7 million. This amount reflects a $38.1 million outflow relating to the special dividend declared and paid as well as $5.4 million used in the net settlement of vested RSUs in the fourth quarter of 2022.
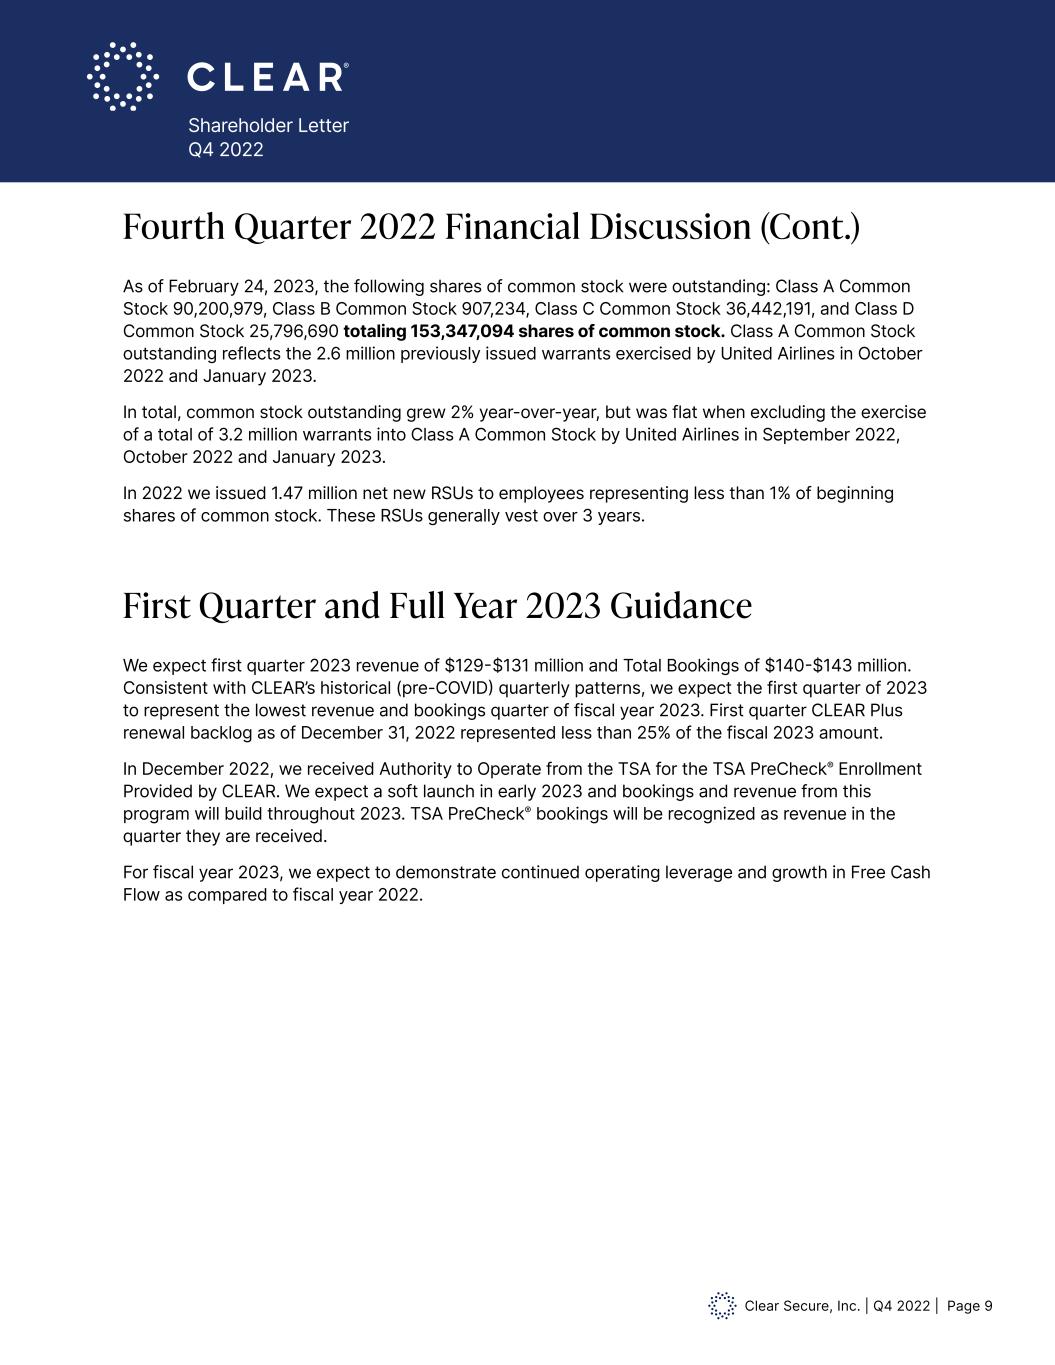
Clear Secure, Inc. | Q4 2022 | Page 9 Shareholder Letter Q4 2022 Fourth Quarter 2022 Financial Discussion (Cont.) As of February 24, 2023, the following shares of common stock were outstanding: Class A Common Stock 90,200,979, Class B Common Stock 907,234, Class C Common Stock 36,442,191, and Class D Common Stock 25,796,690 totaling 153,347,094 shares of common stock. Class A Common Stock outstanding reflects the 2.6 million previously issued warrants exercised by United Airlines in October 2022 and January 2023. In total, common stock outstanding grew 2% year-over-year, but was flat when excluding the exercise of a total of 3.2 million warrants into Class A Common Stock by United Airlines in September 2022, October 2022 and January 2023. In 2022 we issued 1.47 million net new RSUs to employees representing less than 1% of beginning shares of common stock. These RSUs generally vest over 3 years. First Quarter and Full Year 2023 Guidance We expect first quarter 2023 revenue of $129-$131 million and Total Bookings of $140-$143 million. Consistent with CLEAR’s historical (pre-COVID) quarterly patterns, we expect the first quarter of 2023 to represent the lowest revenue and bookings quarter of fiscal year 2023. First quarter CLEAR Plus renewal backlog as of December 31, 2022 represented less than 25% of the fiscal 2023 amount. In December 2022, we received Authority to Operate from the TSA for the TSA PreCheck® Enrollment Provided by CLEAR. We expect a soft launch in early 2023 and bookings and revenue from this program will build throughout 2023. TSA PreCheck® bookings will be recognized as revenue in the quarter they are received. For fiscal year 2023, we expect to demonstrate continued operating leverage and growth in Free Cash Flow as compared to fiscal year 2022.
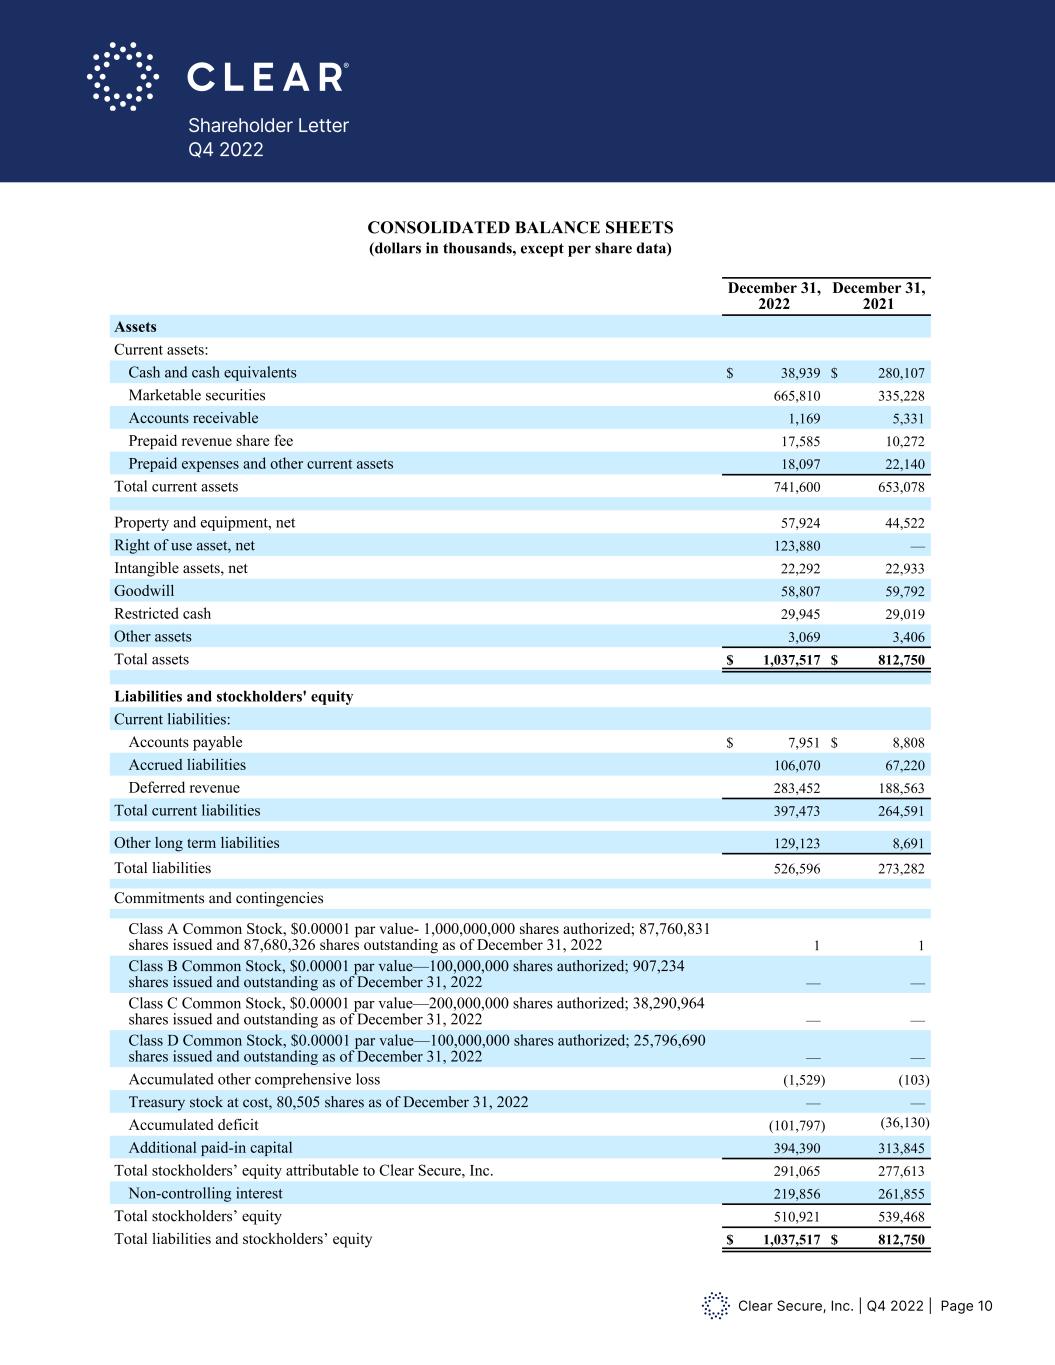
Clear Secure, Inc. | Q4 2022 | Page 10 Shareholder Letter Q4 2022 CLEAR SECURE, INC. CONSOLIDATED BALANCE SHEETS (dollars in thousands, except per share data) December 31, 2022 December 31, 2021 Assets Current assets: Cash and cash equivalents $ 38,939 $ 280,107 Marketable securities 665,810 335,228 Accounts receivable 1,169 5,331 Prepaid revenue share fee 17,585 10,272 Prepaid expenses and other current assets 18,097 22,140 Total current assets 741,600 653,078 Property and equipment, net 57,924 44,522 Right of use asset, net 123,880 — Intangible assets, net 22,292 22,933 Goodwill 58,807 59,792 Restricted cash 29,945 29,019 Other assets 3,069 3,406 Total assets $ 1,037,517 $ 812,750 Liabilities and stockholders' equity Current liabilities: Accounts payable $ 7,951 $ 8,808 Accrued liabilities 106,070 67,220 Deferred revenue 283,452 188,563 Total current liabilities 397,473 264,591 Other long term liabilities 129,123 8,691 Total liabilities 526,596 273,282 Commitments and contingencies Class A Common Stock, $0.00001 par value- 1,000,000,000 shares authorized; 87,760,831 shares issued and 87,680,326 shares outstanding as of December 31, 2022 1 1 Class B Common Stock, $0.00001 par value—100,000,000 shares authorized; 907,234 shares issued and outstanding as of December 31, 2022 — — Class C Common Stock, $0.00001 par value—200,000,000 shares authorized; 38,290,964 shares issued and outstanding as of December 31, 2022 — — Class D Common Stock, $0.00001 par value—100,000,000 shares authorized; 25,796,690 shares issued and outstanding as of December 31, 2022 — — Accumulated other comprehensive loss (1,529) (103) Treasury stock at cost, 80,505 shares as of December 31, 2022 — — Accumulated deficit (101,797) (36,130) Additional paid-in capital 394,390 313,845 Total stockholders’ equity attributable to Clear Secure, Inc. 291,065 277,613 Non-controlling interest 219,856 261,855 Total stockholders’ equity 510,921 539,468 Total liabilities and stockholders’ equity $ 1,037,517 $ 812,750
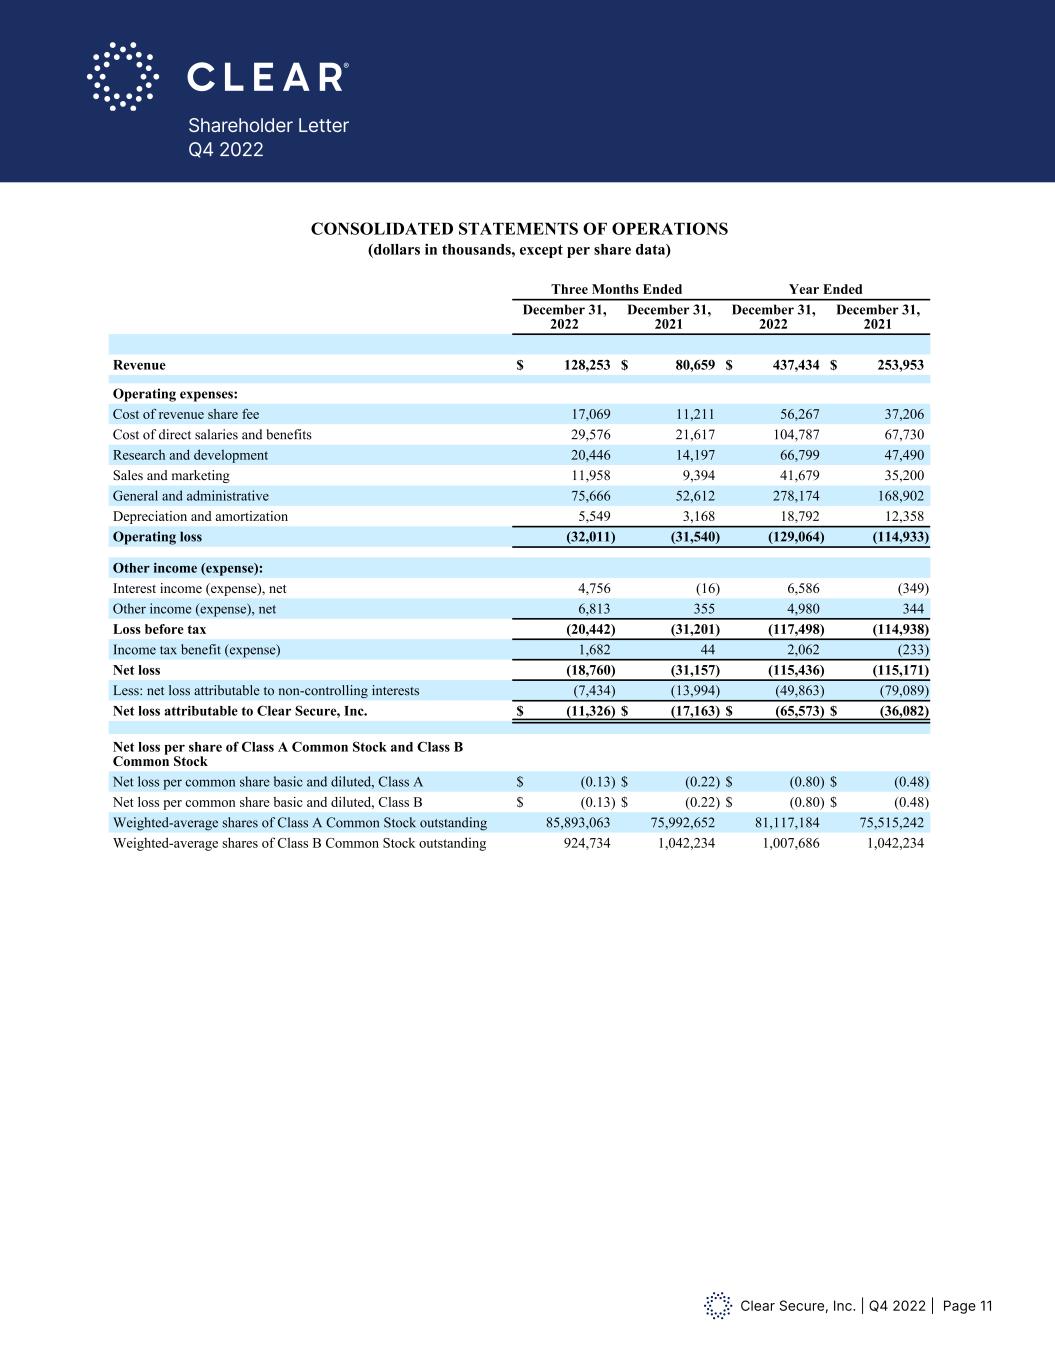
Clear Secure, Inc. | Q4 2022 | Page 11 Shareholder Letter Q4 2022 CLEAR SECURE, INC. CONSOLIDATED STATEMENTS OF OPERATIONS (dollars in thousands, except per share data) Three Months Ended Year Ended December 31, 2022 December 31, 2021 December 31, 2022 December 31, 2021 Revenue $ 128,253 $ 80,659 $ 437,434 $ 253,953 Operating expenses: Cost of revenue share fee 17,069 11,211 56,267 37,206 Cost of direct salaries and benefits 29,576 21,617 104,787 67,730 Research and development 20,446 14,197 66,799 47,490 Sales and marketing 11,958 9,394 41,679 35,200 General and administrative 75,666 52,612 278,174 168,902 Depreciation and amortization 5,549 3,168 18,792 12,358 Operating loss (32,011) (31,540) (129,064) (114,933) Other income (expense): Interest income (expense), net 4,756 (16) 6,586 (349) Other income (expense), net 6,813 355 4,980 344 Loss before tax (20,442) (31,201) (117,498) (114,938) Income tax benefit (expense) 1,682 44 2,062 (233) Net loss (18,760) (31,157) (115,436) (115,171) Less: net loss attributable to non-controlling interests (7,434) (13,994) (49,863) (79,089) Net loss attributable to Clear Secure, Inc. $ (11,326) $ (17,163) $ (65,573) $ (36,082) Net loss per share of Class A Common Stock and Class B Common Stock Net loss per common share basic and diluted, Class A $ (0.13) $ (0.22) $ (0.80) $ (0.48) Net loss per common share basic and diluted, Class B $ (0.13) $ (0.22) $ (0.80) $ (0.48) Weighted-average shares of Class A Common Stock outstanding 85,893,063 75,992,652 81,117,184 75,515,242 Weighted-average shares of Class B Common Stock outstanding 924,734 1,042,234 1,007,686 1,042,234
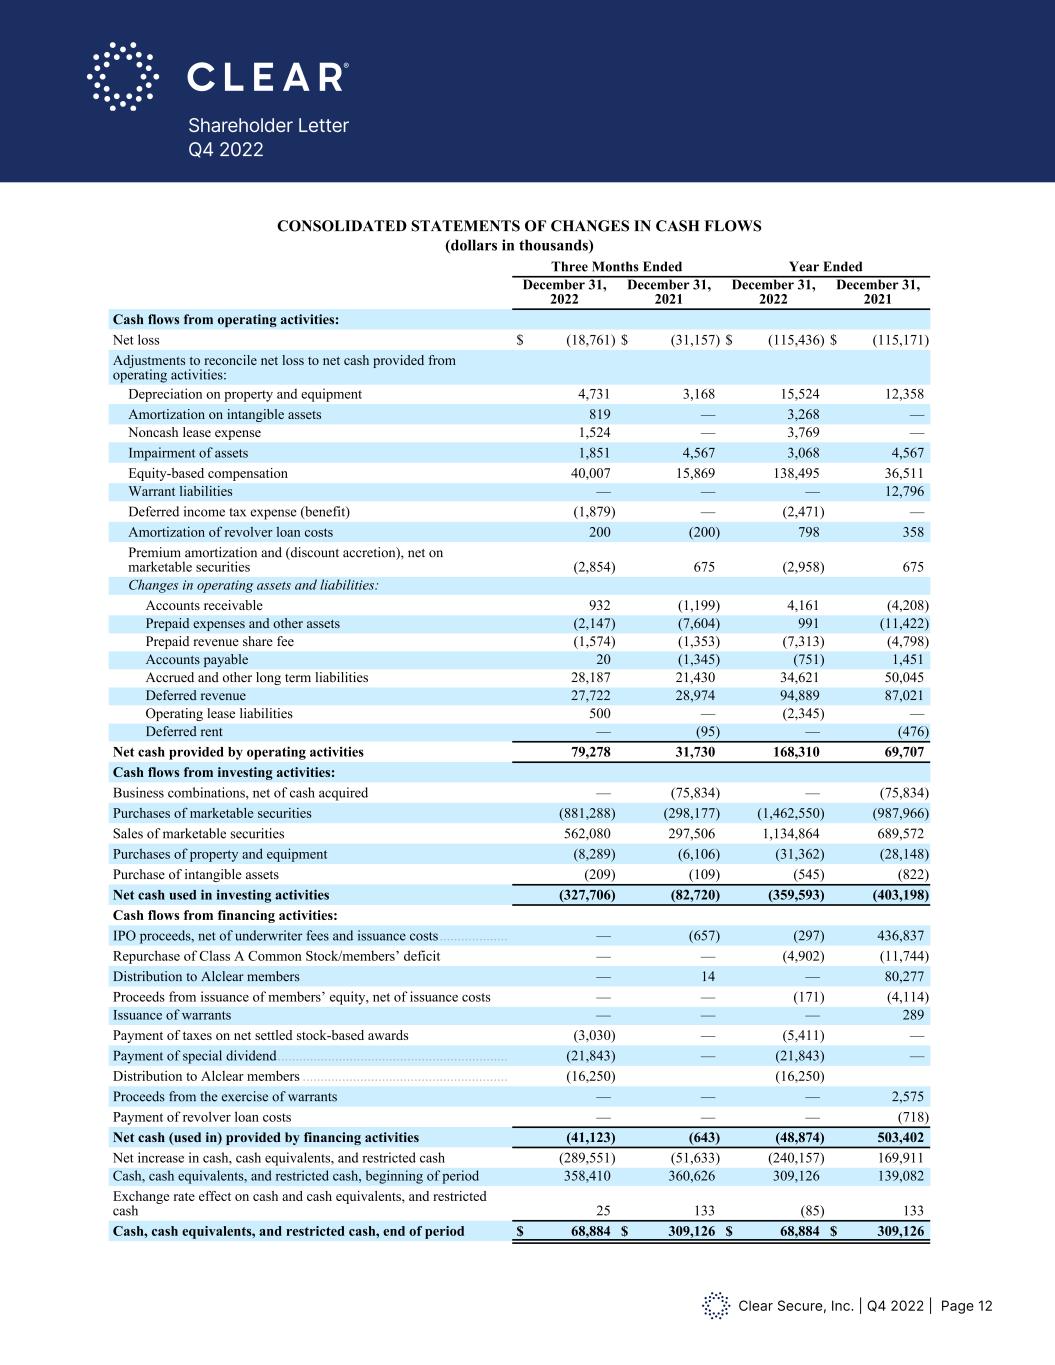
Clear Secure, Inc. | Q4 2022 | Page 12 Shareholder Letter Q4 2022 CLEAR SECURE, INC. CONSOLIDATED STATEMENTS OF CHANGES IN CASH FLOWS (dollars in thousands) Three Months Ended Year Ended December 31, 2022 December 31, 2021 December 31, 2022 December 31, 2021 Cash flows from operating activities: Net loss $ (18,761) $ (31,157) $ (115,436) $ (115,171) Adjustments to reconcile net loss to net cash provided from operating activities: Depreciation on property and equipment 4,731 3,168 15,524 12,358 Amortization on intangible assets 819 — 3,268 — Noncash lease expense 1,524 — 3,769 — Impairment of assets 1,851 4,567 3,068 4,567 Equity-based compensation 40,007 15,869 138,495 36,511 Warrant liabilities — — — 12,796 Deferred income tax expense (benefit) (1,879) — (2,471) — Amortization of revolver loan costs 200 (200) 798 358 Premium amortization and (discount accretion), net on marketable securities (2,854) 675 (2,958) 675 Changes in operating assets and liabilities: Accounts receivable 932 (1,199) 4,161 (4,208) Prepaid expenses and other assets (2,147) (7,604) 991 (11,422) Prepaid revenue share fee (1,574) (1,353) (7,313) (4,798) Accounts payable 20 (1,345) (751) 1,451 Accrued and other long term liabilities 28,187 21,430 34,621 50,045 Deferred revenue 27,722 28,974 94,889 87,021 Operating lease liabilities 500 — (2,345) — Deferred rent — (95) — (476) Net cash provided by operating activities 79,278 31,730 168,310 69,707 Cash flows from investing activities: Business combinations, net of cash acquired — (75,834) — (75,834) Purchases of marketable securities (881,288) (298,177) (1,462,550) (987,966) Sales of marketable securities 562,080 297,506 1,134,864 689,572 Purchases of property and equipment (8,289) (6,106) (31,362) (28,148) Purchase of intangible assets (209) (109) (545) (822) Net cash used in investing activities (327,706) (82,720) (359,593) (403,198) Cash flows from financing activities: IPO proceeds, net of underwriter fees and issuance costs ................... — (657) (297) 436,837 Repurchase of Class A Common Stock/members’ deficit — — (4,902) (11,744) Distribution to Alclear members — 14 — 80,277 Proceeds from issuance of members’ equity, net of issuance costs — — (171) (4,114) Issuance of warrants — — — 289 Payment of taxes on net settled stock-based awards (3,030) — (5,411) — Payment of special dividend ................................................................ (21,843) — (21,843) — Distribution to Alclear members ......................................................... (16,250) (16,250) Proceeds from the exercise of warrants — — — 2,575 Payment of revolver loan costs — — — (718) Net cash (used in) provided by financing activities (41,123) (643) (48,874) 503,402 Net increase in cash, cash equivalents, and restricted cash (289,551) (51,633) (240,157) 169,911 Cash, cash equivalents, and restricted cash, beginning of period 358,410 360,626 309,126 139,082 Exchange rate effect on cash and cash equivalents, and restricted cash 25 133 (85) 133 Cash, cash equivalents, and restricted cash, end of period $ 68,884 $ 309,126 $ 68,884 $ 309,126
Clear Secure, Inc. | Q4 2022 | Page 13 Shareholder Letter Q4 2022 Definitions of Key Performance Indicators To evaluate performance of the business, we utilize a variety of other non-GAAP financial reporting and performance measures. These key measures include Total Bookings, Total Cumulative Enrollments, Total Cumulative Platform Uses, and Annual CLEAR Plus Net Member Retention. Total Bookings Total Bookings represent our total revenue plus the change in deferred revenue during the period. Total Bookings in any particular period reflect sales to new and renewing CLEAR Plus subscribers plus any accrued billings to partners. Management believes that Total Bookings is an important measure of the current health and growth of the business and views it as a leading indicator. Total Cumulative Enrollments We define Total Cumulative Enrollments as the number of enrollments since inception as of the end of the period. An Enrollment is defined as any member who has registered for the CLEAR platform since inception and has a profile (including limited time free trials regardless of conversion to paid membership) net of duplicate and/or purged accounts. This includes CLEAR Plus members who have completed enrollment with CLEAR and have never activated a payment method, plus associated family accounts. Management views this metric as an important tool to analyze the efficacy of our growth and marketing initiatives as new members are potentially a current and leading indicator of revenues. Total Cumulative Platform Uses We define Total Cumulative Platform Uses as the number of individual engagements across CLEAR use cases, including CLEAR Plus, flagship app and Powered by CLEAR, since inception as of the end of the period. Management views this metric as an important tool to analyze the level of engagement of our member base which can be a leading indicator of future growth, retention and revenue. Annual CLEAR Plus Net Member Retention We define Annual CLEAR Plus Net Member Retention as one minus the CLEAR Plus net member churn on a rolling 12 month basis. We define “CLEAR Plus net member churn” as total cancellations net of winbacks in the trailing 12 month period divided by the average active CLEAR Plus members as of the beginning of each month within the same 12 month period. Winbacks are defined as reactivated members who have been cancelled for at least 60 days. Active CLEAR Plus members are defined as members who have completed enrollment with CLEAR and have activated a payment method for our in-airport CLEAR Plus service, including their registered family plan members. Active CLEAR Plus members also include those in a grace period of up to 45 days after a billing failure during which time we attempt to collect updated payment information. Management views this metric as an important tool to analyze the level of engagement of our member base, which can be a leading indicator of future growth and revenue, as well as an indicator of customer satisfaction and long term business economics.
Clear Secure, Inc. | Q4 2022 | Page 14 Shareholder Letter Q4 2022 Non-GAAP Financial Measures In addition to our results as determined in accordance with GAAP, we disclose Adjusted EBITDA (Loss), Free Cash Flow, Adjusted Net Income (Loss) and Adjusted Net Income (Loss) Per Common Share, Diluted as non-GAAP financial measures that management believes provide useful information to investors. These measures are not financial measures calculated in accordance with GAAP and should not be considered as a substitute for net income (loss), or any other operating performance measure calculated in accordance with GAAP, and may not be comparable to a similarly titled measure reported by other companies. Our Non-GAAP financial measures are expressed in thousands. Adjusted EBITDA (Loss) We define Adjusted EBITDA (Loss) as net income (loss) adjusted for income taxes, interest (income) expense net, depreciation and amortization, impairment and losses on asset disposals, equity-based compensation expense, Tax Receivable Agreement liability adjustments, mark to market of warrant liabilities, other income (expense), net excluding sublease rental income, acquisition-related costs and changes in fair value of contingent consideration. Adjusted EBITDA is an important financial measure used by management and our board of directors to evaluate business performance. During the third quarter of fiscal year 2022, we revised our definition of Adjusted EBITDA (Loss) to exclude sublease rental income from our other income (expense) adjustment. During the fourth quarter of fiscal year 2022, we revised our definition of Adjusted EBITDA (Loss) to include impairment on assets as a separate component. We did not revise prior years’ Adjusted EBITDA (Loss) because there was no impact of a similar nature in the prior period that affects comparability. Adjusted Net Income (Loss) We define Adjusted Net Income (Loss) as Net income (loss) attributable to Clear Secure, Inc. adjusted for the net income (loss) attributable to non-controlling interests, equity-based compensation expense, amortization of acquired intangible assets, acquisition-related costs, changes in fair value of contingent consideration and the income tax effect of these adjustments. Adjusted Net Income (Loss) is used in the calculation of Adjusted Net Income (Loss) per Common Share as defined below. Adjusted Net Income (Loss) per Common Share We compute Adjusted Net Income (Loss) per Common Share, Basic as Adjusted Net Income (Loss) divided by Adjusted Weighted-Average Shares Outstanding for our Class A Common Stock, Class B Common Stock, Class C Common Stock and Class D Common Stock assuming the exchange of all vested and outstanding common units in Alclear at the end of each period presented. We do not present Adjusted Net Income (Loss) per Common Share for shares of our Class B Common Stock although they are participating securities based on the assumed conversion of those shares to our Class A Common Stock. We do not present Adjusted Net Income (Loss) per Common Share on a dilutive basis for periods where we have Adjusted Net Loss since we do not assume the conversion of any potentially dilutive equity instruments as the result would be antidilutive. In periods where we have Adjusted Net Income, the Company also calculates Adjusted Net Income per Common Share, Diluted based on the effect of potentially dilutive equity instruments for the periods presented using the treasury stock/if-converted method, as applicable. Adjusted Net Income (Loss) per Common Share is only applicable for periods after June 29, 2021, post the Reorganization Transactions and IPO.
Clear Secure, Inc. | Q4 2022 | Page 15 Shareholder Letter Q4 2022 Adjusted Net Income (Loss) per Common Share (Cont.) Adjusted Net Income (Loss) and Adjusted Net Income (Loss) per Common Share exclude, to the extent applicable, the tax effected impact of non-cash expenses and other items that are not directly related to our core operations. These items are excluded because they are connected to the Company’s long term growth plan and not intended to increase short term revenue in a specific period. Further, to the extent that other companies use similar methods in calculating non-GAAP measures, the provision of supplemental non-GAAP information can allow for a comparison of the company’s relative performance against other companies that also report non-GAAP operating results. Free Cash Flow We define Free Cash Flow as net cash provided by (used in) operating activities adjusted for purchases of property and equipment plus the value of share repurchases over fair value. With regards to our CLEAR Plus subscription service, we generally collect cash from our members upfront for annual subscriptions. As a result, when the business is growing, Free Cash Flow can be a real time indicator of the current trajectory of the business. See below for reconciliations of these non-GAAP financial measures to their most comparable GAAP measures. Forward-Looking Statements This release may contain statements that constitute forward-looking statements within the meaning of the Private Securities Litigation Reform Act of 1995. Investors are cautioned that any and such forward looking statement are not guarantees of future performance or results and involve risks and uncertainties, and that actual results, developments and events may differ materially from those in the forward-looking statements as a result of various factors, including those described in the Company’s filings with the Securities and Exchange Commission, including the sections titled “Risk Factors” in our Annual Report on Form 10-K. The Company disclaims any obligation to update any forward-looking statements contained herein.
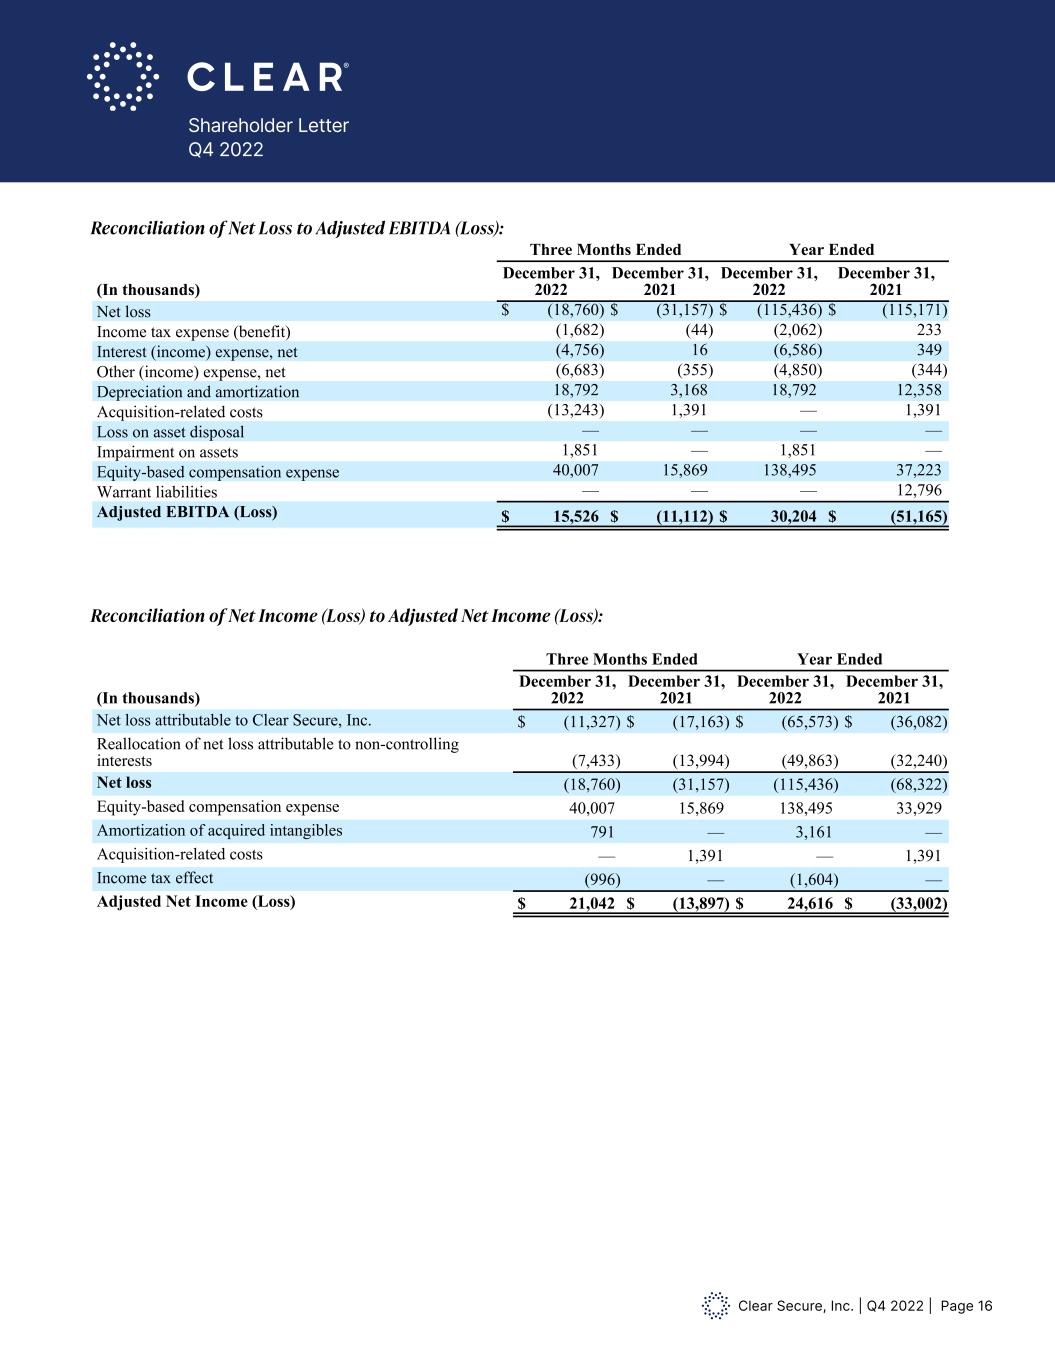
Clear Secure, Inc. | Q4 2022 | Page 16 Shareholder Letter Q4 2022 Three Months Ended Year Ended (In thousands) December 31, 2022 December 31, 2021 December 31, 2022 December 31, 2021 Net loss $ (18,760) $ (31,157) $ (115,436) $ (115,171) Income tax expense (benefit) (1,682) (44) (2,062) 233 Interest (income) expense, net (4,756) 16 (6,586) 349 Other (income) expense, net (6,683) (355) (4,850) (344) Depreciation and amortization 18,792 3,168 18,792 12,358 Acquisition-related costs (13,243) 1,391 — 1,391 Loss on asset disposal — — — — Impairment on assets 1,851 — 1,851 — Equity-based compensation expense 40,007 15,869 138,495 37,223 Warrant liabilities — — — 12,796 Adjusted EBITDA (Loss) $ 15,526 $ (11,112) $ 30,204 $ (51,165) Reconciliation of Net Income (Loss) to Adjusted Net Income (Loss) Three Months Ended Year Ended (In thousands) December 31, 2022 December 31, 2021 December 31, 2022 December 31, 2021 Net loss attributable to Clear Secure, Inc. $ (11,327) $ (17,163) $ (65,573) $ (36,082) Reallocation of net loss attributable to non-controlling interests (7,433) (13,994) (49,863) (32,240) Net loss (18,760) (31,157) (115,436) (68,322) Equity-based compensation expense 40,007 15,869 138,495 33,929 Amortization of acquired intangibles 791 — 3,161 — Acquisition-related costs — 1,391 — 1,391 Income tax effect (996) — (1,604) — Adjusted Net Income (Loss) $ 21,042 $ (13,897) $ 24,616 $ (33,002) Calculation of Adjusted Weighted-Average Shares Outstanding Basic and Diluted Three Months Ended Year Ended December 31, 2022 December 31, 2021 December 31, 2022 December 31, 2021 Weighted-average number of shares outstanding, basic for Class A Common Stock 85,893,063 75,992,652 81,117,184 75,515,242 Adjustments Assumed weighted-average conversion of issued and outstanding Class B Common Stock 924,734 1,042,234 1,007,686 1,042,234 Assumed weighted-average conversion of issued and outstanding Class C Common Stock 39,217,633 44,407,609 41,265,522 44,407,609 Assumed weighted-average conversion of issued and outstanding Class D Common Stock 26,096,669 25,470,311 26,501,898 25,109,283 Assumed weighted-average conversion of vested and outstanding warrants 107,604 101,647 164,623 67,942 Adjusted Weighted-Average Number of Shares Outstanding, Basic 152,239,703 147,014,453 150,056,913 146,142,310 Weighted-average impact of unvested RSAs 259,109 — 863,904 — Weighted-average impact of unvested RSUs 827,958 — 631,104 — Total incremental shares 1,087,067 — 1,495,008 — Adjusted Weighted-Average Number of Shares Outstanding, Diluted 153,326,770 147,014,453 151,551,921 146,142,310 Three Months Ended Year Ended (In thousands) December 31, 2022 December 31, 2021 December 31, 2022 December 31, 2021 Net loss $ (18,760) $ (31,157) $ (115,436) $ (115,171) Income tax expense (benefit) (1,682) (44) (2,062) 233 Interest (income) expense, net (4,756) 16 (6,586) 349 Other (income) expense, net (6,683) (355) (4,850) (344) Depreciation and amortization 18,792 3,168 18,792 12,358 Acquisition-related costs (13,243) 1,391 — 1,391 Loss on asset disposal — — — — Impairment on assets 1,851 — 1,851 — Equity-based compensation expense 40,007 15,869 138,495 37,223 Warrant liabilities — — — 12,796 Adjusted EBITDA (Loss) $ 15,526 $ (11,112) $ 30,204 $ (51,165) Reconciliation of Net Income (Loss) to Adjusted Net Income (Loss) Three Months Ended Year Ended (In thousands) December 31, 2022 December 31, 2021 December 31, 2022 December 31, 2021 Net loss attributable to Clear Secure, Inc. $ (11,327) $ (17,163) $ (65,573) $ (36,082) Reallocation of net loss attributable to non-controlling interests (7,433) (13,994) (49,8 3) (32,240) Net loss (18,760) (3 ,157) (115,436) (68, 22) Equity-based compensation expense 40,007 15,869 138,495 33,929 mortization of acquired intangibles 791 — 3,161 — Acquisition-related costs — 1,391 — 1,391 Income tax effect (996) — (1,604) — Adjusted Net Income (Loss) $ 21,042 $ (13,897) $ 24,616 $ (33,002) Calculation of Adjusted Weighted-Average Shares Outstanding Basic and Diluted Three Months Ended Year Ended December 31, 2022 December 31, 2021 December 31, 2022 December 31, 2021 Weighted-average number of shares outstanding, basic for Class A Common Stock 85,893,063 75,992,652 81,117,184 75,515,242 Adjustments ssu ed eighted-average conversion of issued and outstanding lass B o on Stock 924,734 1,042,234 1,007,686 1,042,234 ssu ed eighted-average conversion of issued and outstanding Class C Common Stock 39,217,633 44,407,609 41,265,522 44,407,609 ssumed weighted-average conversion of issued and outstanding Class D Common Stock 26,096,669 25,470,311 26,501,898 25,109,283 Assumed weighted-average conversion of vested and outstanding warrants 107,604 101,647 164,623 67,942 Adjusted Weighted-Average Number of Shares Outstanding, B sic 152,239,703 147,014,453 150,056,913 146,142,310 Weighted-average impact of unvested RSAs 259,109 — 863,904 — Weighted-average impact of unvested RSUs 827,958 — 631,104 — Total incremental shares 1,087,067 — 1,495,008 — Adjusted Weighted-Average Number of Shares Outstanding, Diluted 153,326,770 147,014,453 151,551,921 146,142,310 Reconciliation of Net Loss to Adjusted EBITDA (Loss): Reconciliation of Net Income (Loss) to Adjusted Net Income (Loss):
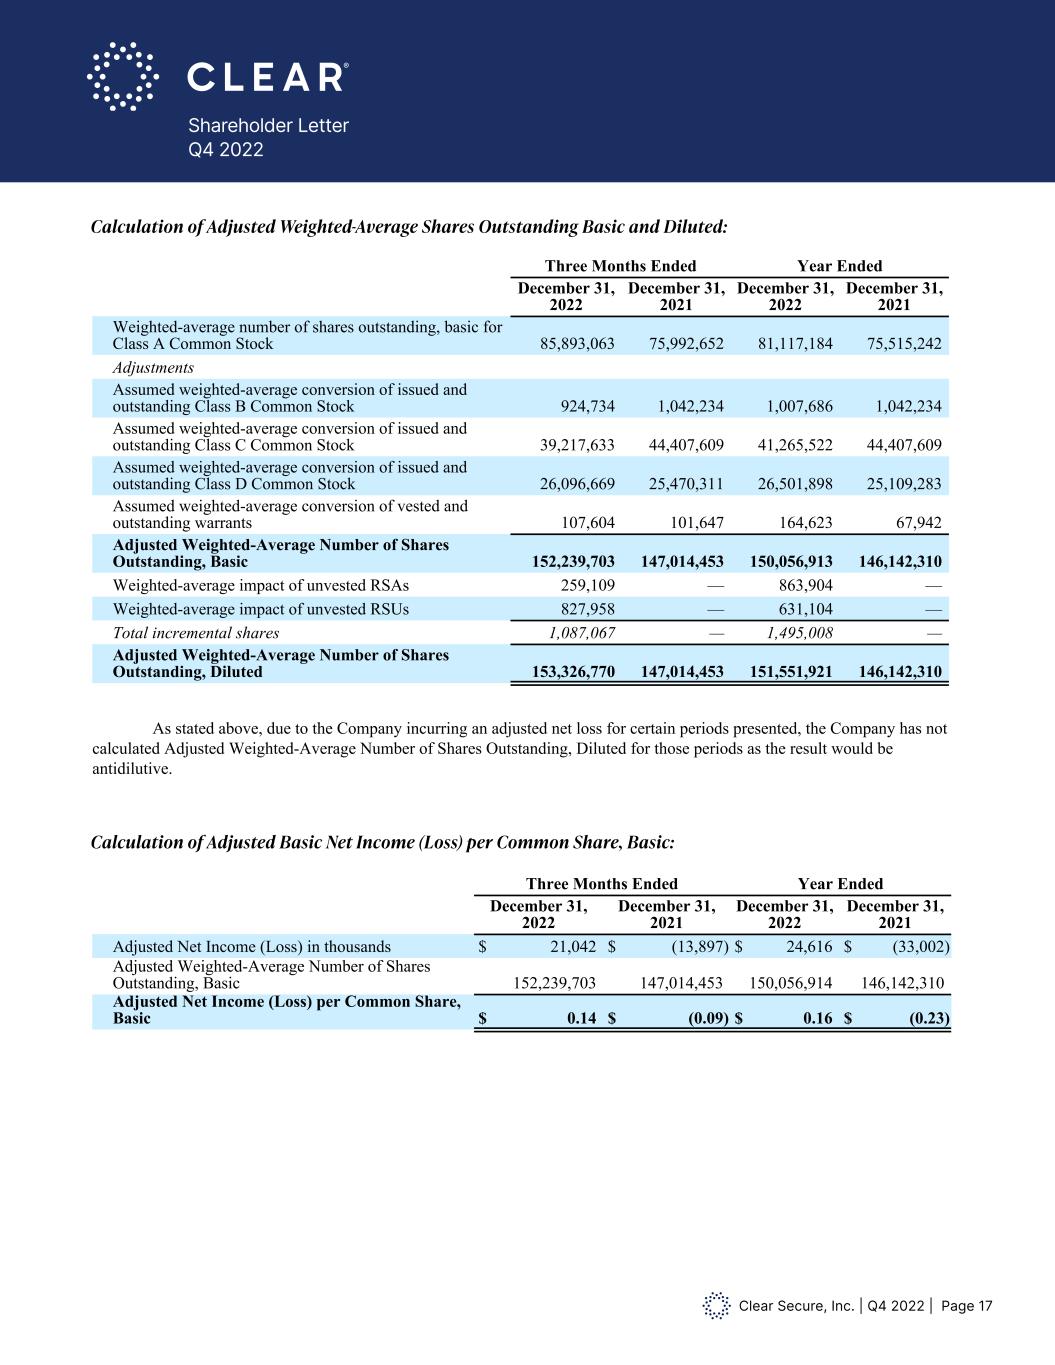
Clear Secure, Inc. | Q4 2022 | Page 17 Shareholder Letter Q4 2022 Three Months Ended Year Ended (In thousands) December 31, 2022 December 31, 2021 December 31, 2022 December 31, 2021 Net loss $ (18,760) $ (31,157) $ (115,436) $ (115,171) Income tax expense (benefit) (1,682) (44) (2,062) 233 Interest (income) expense, net (4,756) 16 (6,586) 349 Other (income) expense, net (6,683) (355) (4,850) (344) Depreciation and amortization 18,792 3,168 18,792 12,358 Acquisition-related costs (13,243) 1,391 — 1,391 Loss on asset disposal — — — — Impairment on assets 1,851 — 1,851 — Equity-based compensation expense 40,007 15,869 138,495 37,223 Warrant liabilities — — — 12,796 Adjusted EBITDA (Loss) $ 15,526 $ (11,112) $ 30,204 $ (51,165) Reconciliation of Net Income (Loss) to Adjusted Net Income (Loss) Three Months Ended Year Ended (In thousands) December 31, 2022 December 31, 2021 December 31, 2022 December 31, 2021 Net loss attributable to Clear Secure, Inc. $ (11,327) $ (17,163) $ (65,573) $ (36,082) Reallocation of net loss attributable to non-controlling interests (7,433) (13,994) (49,863) (32,240) Net loss (18,760) (31,157) (115,436) (68,322) Equity-based compensation expense 40,007 15,869 138,495 33,929 Amortization of acquired intangibles 791 — 3,161 — Acquisition-related costs — 1,391 — 1,391 Income tax effect (996) — (1,604) — Adjusted Net Income (Loss) $ 21,042 $ (13,897) $ 24,616 $ (33,002) Calculation of Adjusted Weighted-Average Shares Outstanding Basic and Diluted Three Months Ended Year Ended December 31, 2022 December 31, 2021 December 31, 2022 December 31, 2021 Weighted-average number of shares outstanding, basic for Class A Common Stock 85,893,063 75,992,652 81,117,184 75,515,242 Adjustments Assumed weighted-average conversion of issued and outstanding Class B Common Stock 924,734 1,042,234 1,007,686 1,042,234 Assumed weighted-average conversion of issued and outstanding Class C Common Stock 39,217,633 44,407,609 41,265,522 44,407,609 Assumed weighted-average conversion of issued and outstanding Class D Common Stock 26,096,669 25,470,311 26,501,898 25,109,283 Assumed weighted-average conversion of vested and outstanding warrants 107,604 101,647 164,623 67,942 Adjusted Weighted-Average Number of Shares Outstanding, Basic 152,239,703 147,014,453 150,056,913 146,142,310 Weighted-average impact of unvested RSAs 259,109 — 863,904 — Weighted-average impact of unvested RSUs 827,958 — 631,104 — Total incremental shares 1,087,067 — 1,495,008 — Adjusted Weighted-Average Number of Shares Outstanding, Diluted 153,326,770 147,014,453 151,551,921 146,142,310 As stated above, due to the Company incurring an adjusted net loss for certain periods presented, the Company has not calculated Adjusted Weighted-Average Number of Shares Outstanding, Diluted for those periods as the result would be antidilutive. Calculation of Adjusted Basic Net Income (Loss) per Common Share, Basic Three Months Ended Year Ended December 31, 2022 December 31, 2021 December 31, 2022 December 31, 2021 Adjusted Net Income (Loss) in thousands $ 21,042 $ (13,897) $ 24,616 $ (33,002) Adjusted Weighted-Average Number of Shares Outstanding, Basic 152,239,703 147,014,453 150,056,914 146,142,310 Adjusted Net Income (Loss) per Common Share, Basic $ 0.14 $ (0.09) $ 0.16 $ (0.23) Calculation of Adjusted Net Income (Loss) per Common Share, Diluted Three Months Ended Year Ended December 31, 2022 December 31, 2022 Adjusted Net Income in thousands $ 21,042 $ 24,616 Adjusted Weighted-Average Number of Shares Outstanding, Diluted 152,239,703 151,551,921 Adjusted Net Income per Common Share, Diluted: $ 0.14 $ 0.16 Summary of Adjusted Net Income (Loss) per Common Share: Three Months Ended Year Ended December 31, 2022 December 31, 2021 December 31, 2022 December 31, 2021 Adjusted Net Income (Loss) per Common Share, Basic $ 0.14 $ (0.09) $ 0.16 $ (0.23) Adjusted Net Income (Loss) per Common Share, Diluted $ 0.14 $ (0.09) $ 0.16 $ (0.23) Reconciliation of Net cash provided by operating activities to Free Cash Flow: Three Months Ended Year Ended (In thousands) December 31, 2022 December 31, 2021 December 31, 2022 December 31, 2021 Net cash provided by operating activities $ 79,280 $ 31,730 $ 168,310 $ 69,707 Purchases of property and equipment (8,289) (6,106) (31,362) (28,148) Share repurchases over fair value — — — 712 Free Cash Flow 70,991 25,624 136,948 42,271 Calculation of Adjusted Weighted-Average Shares Outstanding Basic and Diluted: As stated above, due to the Company incurring an adjusted net loss for certain periods presented, the Company has not calculated Adjusted Weighted-Average Number of Shares Outstanding, Diluted for those periods as the result would be antidilutive. Calculation of Adjusted Basic Net Income (Loss) per Common Share Basic Three Months Ended Year Ended December 31, 2022 December 31, 2021 December 31, 2022 December 31, 2021 Adjusted Net Income (Loss) in thousands $ 21,042 $ (13,897) $ 24,616 $ (33,002) Adjusted Weighted-Average Number of Shares Outstanding, Basic 152,239,703 147,014,453 150,056,914 146,142,310 Adjusted Net Income (Loss) per Common Share, Basic $ 0.14 $ (0.09) $ 0.16 $ (0.23) Calculation of Adjusted Net Income (Loss) per Common Share, Diluted Three Months Ended Year Ended December 31, 2022 December 31, 2022 sted Net Income in thousands 21,042 24,6 Adjusted Weighted-Average Number of Shares Outstanding, Diluted 152,239,703 151,551,921 Adjusted Net Income per Co mon Share, Diluted: $ 0.14 $ 0.16 Summary of Adjusted Net Income (Loss) per Common Share: Three Months Ended Year Ended December 31, 2022 December 31, 2021 December 31, 2022 December 31, 2021 Adjusted Net Income (Loss) per Common Share, Basic $ 0.14 $ (0.09) $ 0.16 $ (0.23) Adjusted Net Income (Loss) per Common Share, Diluted $ 0.14 $ (0.09) $ 0.16 $ (0.23) Reconciliation of Net cash provided by operating activities to Free Cash Flow: Three Months Ended Year Ended (In t ousands) December 31, 2022 December 31, 2021 December 31, 2022 December 31, 2021 Net cash p ovid d by operating activities $ 79,280 $ 31,730 $ 168,310 $ 69, 07 Purchases of property and equipment (8 289) (6 106) ( 1 362) (28 148) Share repurchases over fair value — — — 712 Free Cash Flow 70,991 25,624 136,948 42,271 Calculation of Adjusted Basic Net Income (Loss) per Common Share, Basic:
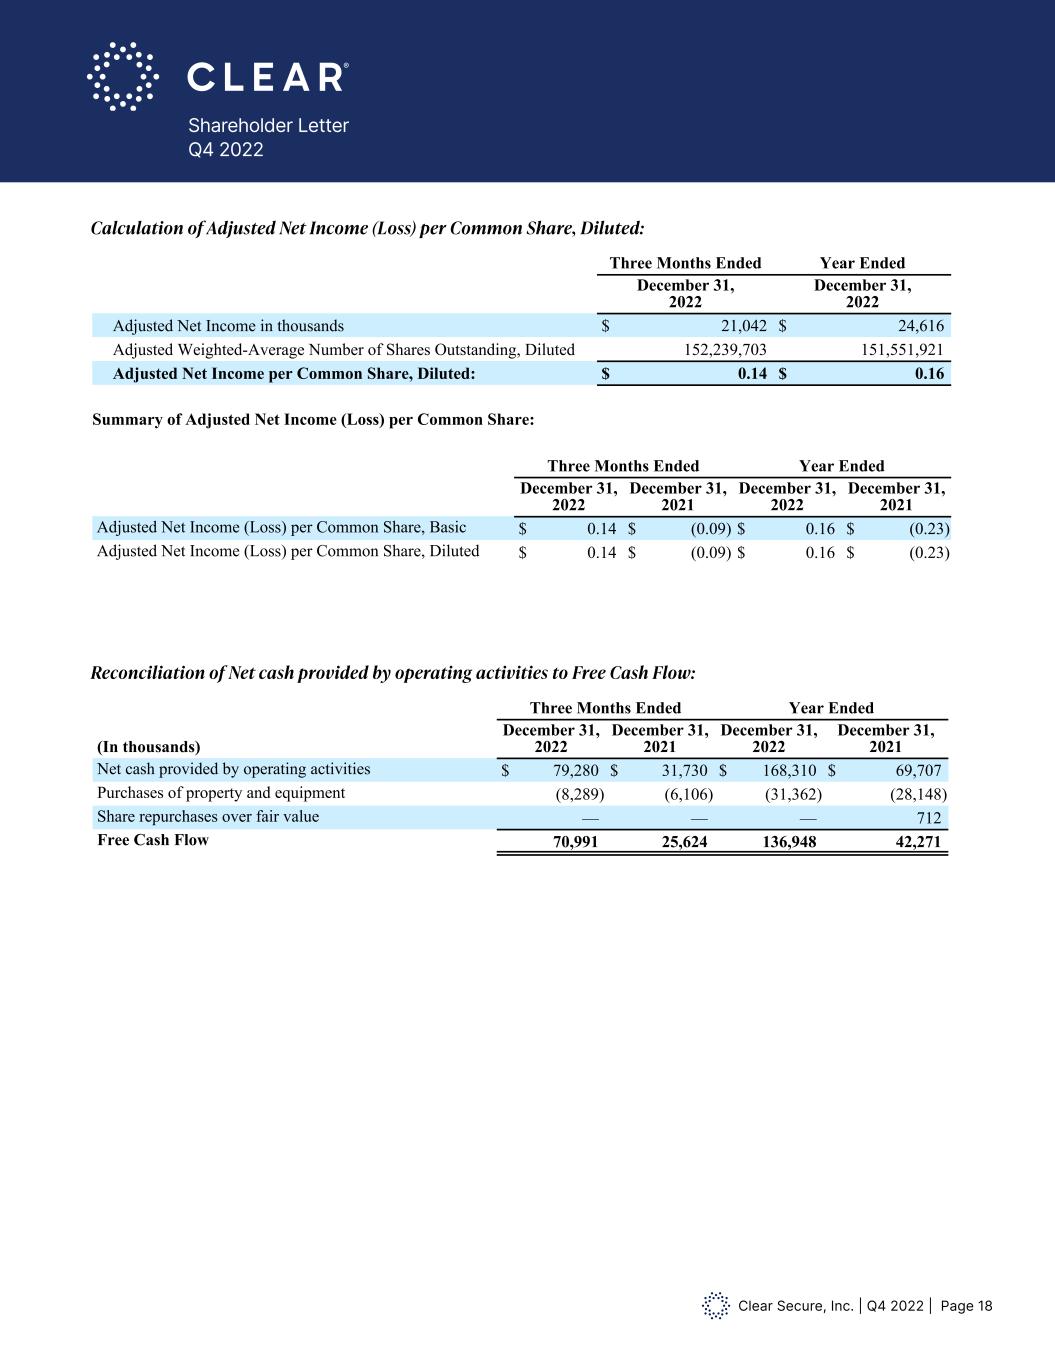
Clear Secure, Inc. | Q4 2022 | Page 18 Shareholder Letter Q4 2022 As stated above, due to the Company incurring an adjusted net loss for certain periods presented, the Company has not calculated Adjusted Weighted-Average Number of Shares Outstanding, Diluted for those periods as the result would be antidilutive. Calculation of Adjusted Basic Net Income (Loss) per Common Share, Basic Three Months Ended Year Ended December 31, 2022 December 31, 2021 December 31, 2022 December 31, 2021 Adjusted Net Income (Loss) in thousands $ 21,042 $ (13,897) $ 24,616 $ (33,002) Adjusted Weighted-Average Number of Shares Outstanding, Basic 152,239,703 147,014,453 150,056,914 146,142,310 Adjusted Net Income (Loss) per Common Share, Basic $ 0.14 $ (0.09) $ 0.16 $ (0.23) Calculation of Adjusted Net Income (Loss) per Common Share, Diluted Three Months Ended Year Ended December 31, 2022 December 31, 2022 Adjusted Net Income in thousands $ 21,042 $ 24,616 Adjusted Weighted-Average Number of Shares Outstanding, Diluted 152,239,703 151,551,921 Adjusted Net Income per Common Share, Diluted: $ 0.14 $ 0.16 Summary of Adjusted Net Income (Loss) per Common Share: Three Months Ended Year Ended December 31, 2022 December 31, 2021 December 31, 2022 December 31, 2021 Adjusted Net Income (Loss) per Common Share, Basic $ 0.14 $ (0.09) $ 0.16 $ (0.23) Adjusted Net Income (Loss) per Common Share, Diluted $ 0.14 $ (0.09) $ 0.16 $ (0.23) Reconciliation of Net cash provided by operating activities to Free Cash Flow: Three Months Ended Year Ended (In thousands) December 31, 2022 December 31, 2021 December 31, 2022 December 31, 2021 Net cash provided by operating activities $ 79,280 $ 31,730 $ 168,310 $ 69,707 Purchases of property and equipment (8,289) (6,106) (31,362) (28,148) Share repurchases over fair value — — — 712 Free Cash Flow 70,991 25,624 136,948 42,271 Calculation of Adjusted Net Income (Loss) per Common Share, Diluted: As stated above, due to the Company incurring an adjusted net loss for certain periods presented, the Company has not calculated Adjusted Weighted-Average Number of Shares Outstanding, Diluted for those periods as the result would be antidilutive. Calculation of Adjusted Basic Net Income (Loss) per Common Share, Basic Three Months Ended Year Ended December 31, 2022 December 31, 2021 December 31, 2022 December 31, 2021 Adjusted Net Income (Loss) in thousands $ 21,042 $ (13,897) $ 24,616 $ (33,002) Adjusted Weighted-Average Number of Shares Outstanding, Basic 152,239,703 147,014,453 150,056,914 146,142,310 Adjusted Net Income (Loss) per Common Share, Basic $ 0.14 $ (0.09) $ 0.16 $ (0.23) Calculation of Adjusted Net Income (Loss) per Common Share, Diluted Three Months Ended Year Ended December 31, 2022 December 31, 2022 Adjusted Net Income in thousands $ 21,042 $ 24,616 Adjusted Weighted-Average Number of Shares Outstanding, Diluted 152,239,703 151,551,921 Adjusted Net Income per Common Share, Diluted: $ 0.14 $ 0.16 Summary of Adjusted Net Income (Loss) per Common Share: Three Months Ended Year Ended December 31, 2022 December 31, 2021 December 31, 2022 December 31, 2021 Adjusted Net Income (Loss) per Common Share, Basic $ 0.14 $ (0.09) $ 0.16 $ (0.23) Adjusted Net Income (Loss) per Common Share, Diluted $ 0.14 $ (0.09) $ 0.16 $ (0.23) Reconciliation of Net cash provided by operating activities to Free Cash Flow: Three Months Ended Year Ended (In thousands) December 31, 2022 December 31, 2021 December 31, 2022 December 3 , 2021 Net cash provided by operating activities $ 79,280 $ 31,730 $ 168,310 $ 69,707 Purchases of property and equipment (8,289) (6,106) (31,362) (28,148) Share repurchases over fair value — — — 712 Free Cash Flow 70,991 25,624 136,948 42,271 Reconciliation of Net cash provided by operating activities to Free Cash Flow:
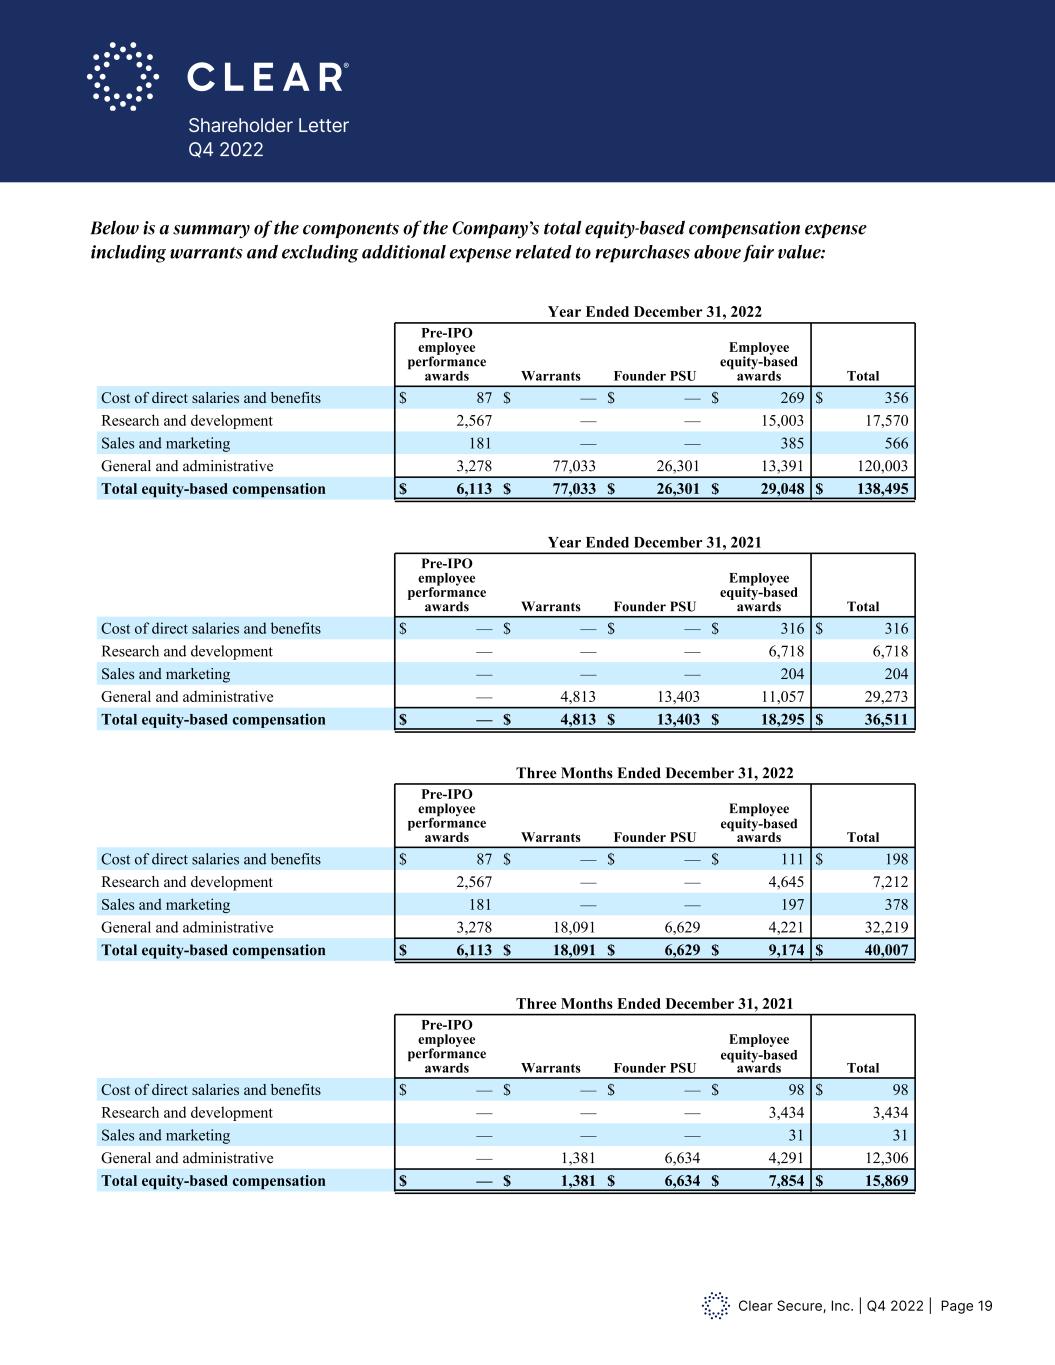
Clear Secure, Inc. | Q4 2022 | Page 19 Shareholder Letter Q4 2022 Below is a summary of the components of the Company’s total equity-based compensation expense including warrants and excluding additional expense related to repurchases above fair value: Year Ended December 31, 2022 Pre-IPO employee performance awards Warrants Founder PSU Employee equity-based awards Total Cost of direct salaries and benefits ................. $ 87 $ — $ — $ 269 $ 356 Research and development ............................. 2,567 — — 15,003 17,570 Sales and marketing ........................................ 181 — — 385 566 General and administrative ............................. 3,278 77,033 26,301 13,391 120,003 Total equity-based compensation ................ $ 6,113 $ 77,033 $ 26,301 $ 29,048 $ 138,495 Year Ended December 31, 2021 Pre-IPO employee performance awards Warrants Founder PSU Employee equity-based awards Total Cost of direct salaries and benefits ................. $ — $ — $ — $ 316 $ 316 Research and development ............................. — — — 6,718 6,718 Sales and marketing ........................................ — — — 204 204 General and administrative ............................. — 4,813 13,403 11,057 29,273 Total equity-based compensation ................ $ — $ 4,813 $ 13,403 $ 18,295 $ 36,511 Three Months Ended December 31, 2022 Pre-IPO employee performance awards Warrants Founder PSU Employee Equity-based awards Total Cost of direct salaries and benefits ................. $ 87 $ — $ — $ 111 $ 198 Research and development ............................. 2,567 — — 4,645 7,212 Sales and marketing ........................................ 181 — — 197 378 General and administrative ............................. 3,278 18,091 6,629 4,221 32,219 Total equity-based compensation ................ $ 6,113 $ 18,091 $ 6,629 $ 9,174 $ 40,007 Three Months Ended December 31, 2021 Pre-IPO employee performance awards Warrants Founder PSU Employee Equity-based awards Total Cost of direct salaries and benefits ................. $ — $ — $ — $ 98 $ 98 Research and development ............................. — — — 3,434 3,434 Sales and marketing ........................................ — — — 31 31 General and administrative ............................. — 1,381 6,634 4,291 12,306 Total equity-based compensation ................ $ — $ 1,381 $ 6,634 $ 7,854 $ 15,869 Components of Results of Operations Revenue The Company derives substantially all of its revenue from subscriptions to its consumer aviation service, CLEAR Plus. The Company offers certain limited-time free trials, family pricing, and other beneficial pricing through several channels, Below is a summary of the components of the Company’s total equity-based compensation expense including warrants and excluding additional expense related to repurchases above fair value: e i e i Below is a summary of the components of the Company’s total equity-based compensation expense including warrants and excluding additional expense related to repurchases above fair value: Year Ended December 31, 2022 Pre-IPO employee performance awards Warrants Founder PSU Employee equity-based awards Total Cost of direct salaries and benefits ................. $ 87 $ $ $ 269 $ 356 Research and development ............................. 2,567 15,003 17,570 Sales and marketing ........................................ 181 385 566 General and administrative ............................. 3,278 77,033 26,301 13,391 120,003 Total equity-based compensation ................ $ 6,113 $ 77,033 $ 26,301 $ 29,048 $ 138,495 Year Ended December 31, 2021 Pre-IPO employee performance awards Warrants Founder PSU Employee equity-based awards Total Cost of direct salaries and benefits ................. $ $ $ $ 316 $ 316 Research and development ............................. 6,718 6,718 Sales and marketing ........................................ 204 204 General and administrative ............................. 4,813 13,403 11,057 29,273 Total equity-based compensation ................ $ $ 4,813 $ 13,403 $ 18,295 $ 36,511 Three Months Ended December 31, 2022 Pre-IPO employee performance awards Warrants Founder PSU Employee Equity-based awards Total Cost of direct salaries and benefits ................. $ 87 $ $ $ 111 $ 198 Research and development ............................. 2,567 4,645 7,212 Sales and marketing ........................................ 181 197 378 General and administrative ............................. 3,278 18,091 6,629 4,221 32,219 Total equity-based compensation ................ $ 6,113 $ 18,091 $ 6,629 $ 9,174 $ 40,007 Three Months Ended December 31, 2021 Pre-IPO employee performance awards Warrants Founder PSU Employee Equity-based awards Total Cost of direct salaries and benefits ................. $ $ $ $ 98 $ 98 Research and development ............................. 3,434 3,434 Sales and marketing ........................................ 31 31 General and administrative ............................. 1,381 6,634 4,291 12,306 Total equity-based compensation ................ $ $ 1,381 $ 6,634 $ 7,854 $ 15,869 Components of Results of Operations Revenue The Company derives substantially all of its revenue from subscriptions to its consumer aviation service, CLEAR Plus. The Company offers certain limited-time free trials, family pricing, and other beneficial pricing through several channels, Below is a summary of the components of the Company’s total equity-based compensation expense including warrants and excluding additional expense related to repurchases above fair value: 2 87 269 5 2,567 15 003 17 570 181 385 566 3,278 77 03 26 3 1 3 391 1 0 00 6,113 77 03 26 3 1 29 048 1 8 495 Year Ended D cember 31, 2021 e it - — 3 6 316 — 6 718 6 7 8 — 204 204 — 4 813 13 403 11 057 29 73 — 4 813 13 403 18 295 36 511 2 87 111 1 2,567 4 645 7 212 181 197 378 3,278 18 09 29 2 3 219 6,113 18 09 29 9 17 40 007 Three Months Ended December 31, 2021 Pre-IPO employee performance awards Warrants Founder PSU Employee Equity-based awards Total Cost of direct salaries and benefits ................. $ — $ — $ — $ 98 $ 98 Research and development ............................. — — — 3,434 3,434 Sales and marketing ........................................ — — — 31 31 General and administrative ............................. — 1,381 6,634 4,291 12,306 Total equity-based compensation ................ $ — $ 1,381 $ 6,634 $ 7,854 $ 15,869 Components of Results of Operations Revenue The Company derives substantially all of its revenue from subscriptions to its consumer aviation service, CLEAR Plus. The Company offers certain limited-time free trials, family pricing, and other beneficial pricing through several channels, Below is a summary of the components of the Company’s total equity-based compensation expense including warrants and excluding additional expense related to repurchases above fair value: 2 269 5 15 003 1 570 385 566 77 3 2 3 1 3 39 1 0 00 77 3 2 3 1 2 048 1 8 495 Year Ended D cember 31, 2021 e it - 3 6 316 6 718 6 7 8 204 204 4 813 13 403 11 057 29 73 4 813 13 403 18 295 36 511 2 87 111 1 2,567 4 645 7 212 181 197 378 3,278 18 09 29 2 3 219 6,113 18 09 29 9 17 40 007 Three Months Ended December 31, 2021 Pre-IPO employee performance awards Warrants Founder PSU Employee Equity-based awards Total Cost of direct salaries and benefits ................. $ — $ — $ — $ 98 $ 98 Research and development ............................. — — — 3,434 3,434 Sales and marketing ........................................ — — — 31 31 General and administrative ............................. — 1,381 6,634 4,291 12,306 Total equity-based compensation ................ $ — $ 1,381 $ 6,634 $ 7,854 $ 15,869 Components of Results of Operations Revenue The Company derives substantially all of its revenue from subscriptions to its consumer aviation service, CLEAR Plus. The Company offers certain limited-time free trials, family pricing, and other beneficial pricing through several channels, Below is a summary of the components of the Company’s total equity-based compensation expense including warrants and excluding additional expense related to repurchases above fair value: 2 269 5 15 003 1 570 385 566 77 3 2 3 1 3 3 1 0 0 77 3 2 3 1 2 048 1 8 495 Year Ended D cember 31, 2021 e it - 3 6 316 6 718 6 7 8 204 204 4 813 13 403 11 057 29 73 4 813 13 403 18 295 36 511 2 87 111 1 2,567 4 645 7 212 181 197 378 3,278 18 09 29 2 3 219 6,113 18 09 29 9 17 40 007 Three Months Ended December 31, 2021 Pre-IPO employee performance awards Warrants Founder PSU Employee Equity-based awards Total Cost of direct salaries and benefits ................. $ — $ — $ — $ 98 $ 98 Research and development ............................. — — — 3,434 3,434 Sales and marketing ........................................ — — — 31 31 General and administrative ............................. — 1,381 6,634 4,291 12,306 Total equity-based compensation ................ $ — $ 1,381 $ 6,634 $ 7,854 $ 15,869 Components of Results of Operations Revenue The Company derives substantially all of its revenue from subscriptions to its consumer aviation service, CLEAR Plus. The Company offers certain limited-time free trials, family pricing, and other beneficial pricing through several channels, l i r f t t f t ’ t t l it - ti i l i rr t l i iti l r l t t r r f ir l : , - l f t l it - t l t f ir t l ri fit ................. — — r l t ............................. , — — , , l r ti ........................................ — — r l i i tr ti ............................. , , , , , t l it - ti ................ , , , , , , - l f t l it - t l t f ir t l ri fit ................. — — — r l t ............................. — — — , , l r ti ........................................ — — — r l i i tr ti ............................. — , , , , t l it - ti ................ — , , , , t , - l f t l it - t l t f ir t l ri fit ................. — — r l t ............................. , — — , , l r ti ........................................ — — r l i i tr ti ............................. , , , , , t l it - ti ................ , , , , , t , - l f t l it - t l t f ir t l ri fit ................. — — — r l t ............................. — — — , , l r ti ........................................ — — — r l i i tr ti ............................. — , , , , t l it - ti ................ — , , , , t f lt f ti ri t ti ll ll f it r fr ri ti t it r i ti r i , l . ff r rt i li it -ti fr tri l , f il ri i , t r fi i l ri i t r r l l , l i r f t t f t ’ t t l it - ti i l i rr t l i iti l r l t t r r f ir l : , , , , it - , , , t , - l f t l it - t l t f ir t l ri fit ................. r l t ............................. , , l r ti ........................................ r l i i tr ti ............................. , , , , t l it - ti ................ , , , , t f lt f ti ri t ti ll ll f it r fr ri ti t it r i ti r i , l . ff r rt i li it -ti fr tri l , f il ri i , t r fi i l ri i t r r l l , l i r f t t f t ’ t t l it - ti i l i rr t l i iti l r l t t r r f ir l : , it - , , , t , - l f t l it - t l t f ir t l ri fit ................. r l t ............................. , , l r ti ........................................ r l i i tr ti ............................. , , , , t l it - ti ................ , , , , t f lt f ti ri t ti ll ll f it r fr ri ti t it r i ti r i , l . ff r rt i li it -ti fr tri l , f il ri i , t r fi i l ri i t r r l l , l i r f t t f t ’ t t l it - ti i l i rr t l i iti l r l t t r r f ir l : , it - I s s s s , , , t , - l f t l it - t l t f ir t l ri fit ................. r l t ............................. , , l r ti ........................................ r l i i tr ti ............................. , , , , t l it - ti ................ , , , , t f lt f ti ri t ti ll ll f it r fr ri ti t it r i ti r i , l . ff r rt i li it -ti fr tri l , f il ri i , t r fi i l ri i t r r l l ,
